Home - Techniek - Electronica - Radiotechniek - Radio amateur bladen - Ham radio - Design curves for loudness-compensated volume controls
Hams deal with AF problems on occasion. Once one of my ham friends complained about the trouble he had adjusting the loudness-compensated volume control in his homemade FM receiver. I decided to analyze and test a popular loudness-compensated volume control circuit and make a set of experimental curves demonstrating how and to what extent different components' values affect its performance.
This work, though tedious, is worthwhile as one can easily determine the proper values of circuit components in minutes.
It's known that the human ear is not equally responsive across the audio range. It's more sensitive to mid-frequencies than to the lower andhigher frequencies. This situation becomes more pronounced at low volume levels.
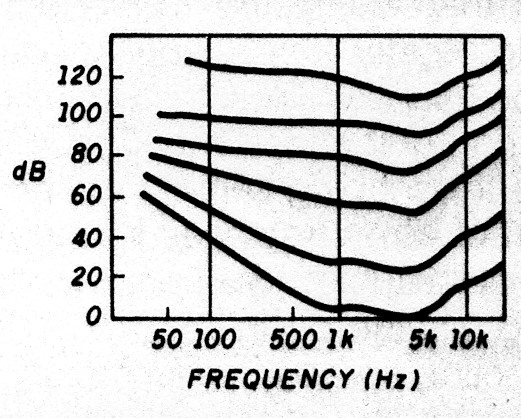
Fig. 1 - Equal loudness curves to human ear at different power levels.
The equal loudness curves given in Figure 1 show the nonlinear frequency response of the ear. We see that for equal loudness the amplifier output at bass and treble frequencies should be greater than at mid-frequencies. So, for best reception of music or other signals with a wide frequency range, it's desirable to use a volume control with properly designed loudness-compensated characteristics. This means at low volume settings the amplifier output should be greater as frequency goes lower or higher from the mid-frequencies.
Circuit and working principle
The loudness-compensated volume control which I analyzed and tested is shown in Figure 2.
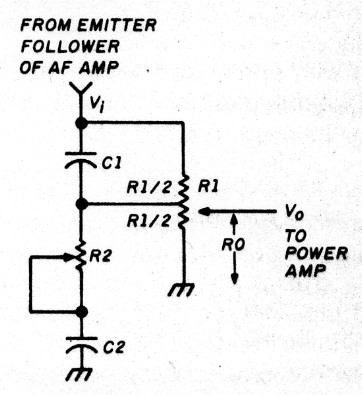
Fig. 2 - Loudness-compensated volume control circuit.
R1 is a center-tapped pot. The combined impedance of C1 in parallel with R112, or R, decreases as frequency increases from the mid-frequencies, so the treble range is boosted. The combined impedance of C2 in series with R2 increases as frequency decreases from mid-frequecies, so bass frequencies are boosted.
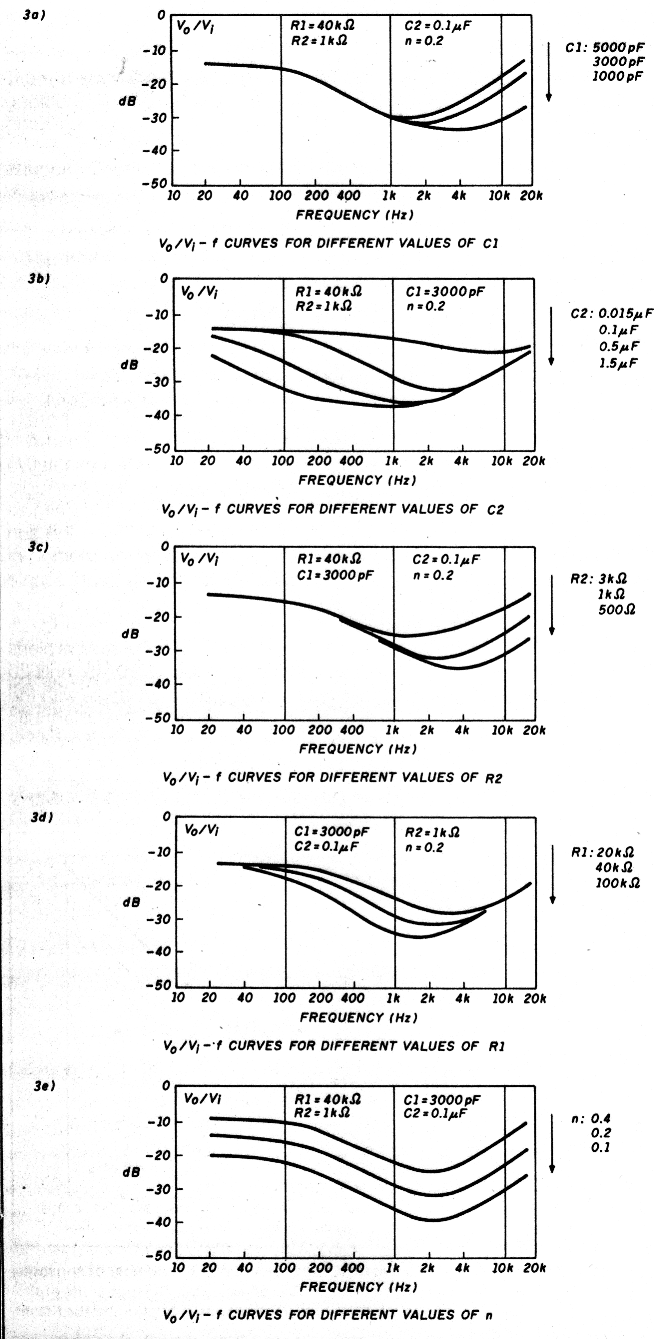
Fig. 3 - Voltage transfer function characteristics of the loudness-compensated volume control in figure 2.
Voltage transfer function of the loudness-compensated volume control
The voltage transfer function in dB of the loudness-compensated volume control through circuit analysis can be expressed as
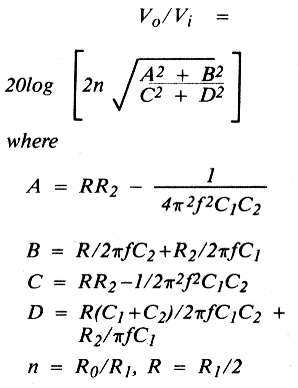
since we are only interested in the low volume case, for n = 1/2.
Experimental curves and conclusions
The loudness-compensated volume control was tested for its voltage transfer function as a function of frequency under various circuit conditions. The experimental curves are shown in Figures 3A through 3E.
All the experimental curves shown are in agreement with the computer data of the analytical expression, and give useful information about the effects of components values on the circuit performance.
These curves indicate that decreasing the value of C1 will shift the minimum-output frequency (MOF) to the high frequency sidg and lower the output power in the high frequency range. The transfer function characteristics remain unaltered below mid-frequencies. Increasing the value of C2 will mainly shift the MOF towards the low frequency side and lower the power output in the low frequency range. The transfer function characteristics remain basically the same above mid-frequencies if the value of C2 is not too small.
Decreasing the value of R2 shows somewhat the same effects as decreasing the value of C1. Increasing the value of R1 shows somewhat the same effects as increasing the value of C2.
The following is a design example. With the component values shown in Figure 3E, the MOF is near 3 kHz. As the volume control is turned down, decreasing the value of n, both bass and treble are boosted.
Teeng C. Liao