Home - Techniek - Electronica - Radiotechniek - Radio amateur bladen - QST - An inexpensive spectrum analyzer for the radio amateur
Like Alice's looking glass, the spectrum analyzer allows you to enter another world. It's your window on the world of RF.
The spectrum analyzer is an indispensable sable tool for the RF designer. Although the radio amateur could benefit from the use of such a tool, few if any can afford the stiff price tag of a commercially made unit. Home construction of a spectrum analyzer appears to be an awesome task. Note that I said appears. With the help of some readily available building blocks, the task is made easier and inexpensive. Before describing the design and construction of our homemade analyzer, let's review some of the basics of their operation.
How a Spectrum Analyzer Works
Basically, the spectrum analyzer is an up-converting superheterodyne receiver outfitted with a visual display. Several years ago, the concept of up-conversion would require considerable discussion, but with practically all HF receivers being designed that way today, we'll only touch on the subject.
Up-Conversion
In up-conversion, the input frequency is converted to a first IF that is above the highest input frequency to be received. This places the image frequency well beyond the range of desired input frequencies so that a fixed-tuned preselector filter can be used. There are some advantages to using up-conversion in a communications receiver, but in a spectrum analyzer, in which the entire input range of frequencies must be swept, it is an absolute necessity. The low-pass filter used in the front end of the analyzer does not need to be frequency swept, so only the local oscillator (LO) frequencies determine the frequency to which the spectrum analyzer is tuned. It is usually difficult to obtain the required selectivity at the high first IF, so a second frequency conversion is required. Because the first IF of a VHF or UHF spectrum analyzer is well into the UHF region, it is often necessary to perform a third frequency conversion as well.
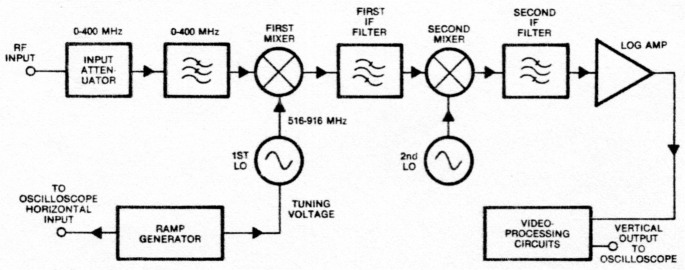
Fig. 1 - Block diagram of our spectrum analyzer.
Refer to Fig. 1. In this block diagram of our spectrum analyzer, the input frequency range is chosen to be from 0 to 400 MHz. The first IF, which is required to be above the highest input frequency, is 516 MHz. The frequency chosen for this IF is a compromise between one that will not produce serious spurious responses and some "nice round number" that might permit the use of an electronic frequency reiidout. Our analyzer will have an ultimate IF bandwidth of about 10 kHz, and so a second, and possibly a third, frequency conversion is required. The second IF should be high enough so that the first IF filter can remove the image frequency. For this purpose, a 61.5-MHz IF has been chosen. The image, removed from the desired frequency by twice the IF, is 123 MHz. It may appear that a much lower second IF may be sufficient, but at the 516-MHz first IF, it is not easy to create high-Q resonators or provide a high amount of ultimate attenuation.
The 61.5-MHz second IF makes it difficult to provide a selectivity on the order of 10 kHz, so a third conversion is required. For our example, this IF is 10.7 MHz. At this frequency, it is not difficult to obtain crystal filters with passbands on the order of a few kilohertz.
Unlike the communications receiver, the spectrum analyzer must be tuned rapidly and electronically so the entire input spectrum can be displayed. This is done by simply making the first LO voltage tunable while the frequencies of the second and third LOs are fixed. This permits the entire spectrum analyzer input-frequency range to be swept by varying the frequency of a single oscillator.
The information displayed by the spectrum analyzer is the amplitude of the input signal vs. frequency. It is in this respect that the spectrum analyzer again deviates from the communications receiver-no demodulation of the input signal is required. The power range of the input signal can span a wide range, typically 60 dB or more. This implies a power range of a million to one! If this range were displayed in a linear fashion, although large signals would be easily visible on the screen, the smaller signals would be practically invisible. To alleviate this problem, a logarithmic display calibrated in decibel, is desired. In order to convert the linear signals to a logarithmic display within the analyzer, special IF amplifiers known as "log amps" are used.
Perhaps the two largest stumbling blocks to a home-constructed spectrum analyzer are the RF circuits and the log amp. If these two hurdles can be overcome, the re maining circuits-power supplies, display amplifiers; weep voltage generators and so on-are relatively simple, low-frequency circuits that could be built easily in the home shop.
The spectrum analyzer to be described provides you with a source for these difficult-to-build components and reduces the required construction to that of the low-frequency circuits. Our source' for the RF circuits is a common cable-television (CATV) set-top converter. The frequencies used as an example in the discussion in the previous paragraphs were selected to reduce spurious responses, but also are those commonly used in a CATV converter! With the proliferation of CATV, these set-top converters will eventually become available as inexpensive items on the new, surplus and scrap markets. Practically any oscilloscope worth its place on your workbench can be used for the display.
Building Blocks
The RF module used for the spectrum analyzer described in this article is a Jerrold 400, often found for sale as a new item as well as a surplus unit. The input-frequency range of the '400 is 54-400 MHz, and can be used as the basis for a 400-MHz spectrum analyzer. For the RF module to be used in a spectrum analyzer, some minor modifications are required. The converter covers frequencies from 54 to 400 MHz for a total of 62 channels. As shown in Fig. 2, the input filter consists of a low-pass filter with a 400-MHz cutoff frequency and a high-pass filter with a 54-MHz cutoff frequency. The high-pass filter is removed, resulting in an effective input-frequency range of from 0 to 400 MHz. The first IF tuned circuit is 6 MHz wide to cover the width of an entire television channel and spans 512.5 to 518.5 MHz. The output tuned circuit is also a 6-MHz wide filter and is tuned to TV Channel 2 or 3 depending on which channel is assigned to the area in which the converter is used. Both filters are left intact, although they are wider than necessary for use in a spectrum analyzer. This way, only minimal retuning of the circuits in the RF module is required. With the removal of the input high-pass filter, the CATV converter RF module is capable of converting all frequencies from almost 0 to 400 MHz to Channel 2 or 3. A third conversion is added externally to the module to convert the output to 10.7 MHz where standard receiver IF filters are used.
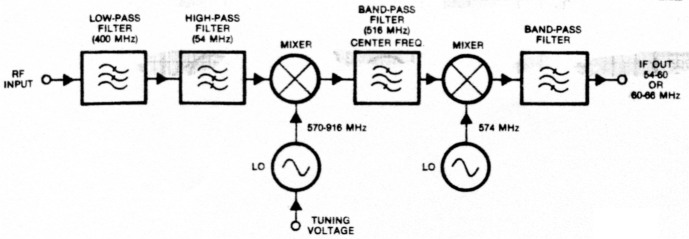
Fig. 2 - Block diagram of a CATV converter.
Building a spectrum analyzer of this sort depends on your ability to obtain the CATV converter.(1) The Jerrold 400 seems to be a widely distributed converter, and there should be a good supply of parts. The RF module is produced by at least two manufacturers, which further enhances the chance of the unit becoming available. In addition to the Jerrold unit, there are several other manufacturers of CATV converters, and many of the newer units cover frequencies in excess of 450 MHz. Regardless of the manufacturer or the vintage of the converter, all of the CATV converters operate on the same principle. Although the frequencies are different, the converters fit the block diagram of Fig. 1. Some of the very early converters are not frequency synthesized and do not contain a frequency prescaler.(2) In many of these units, the input-frequency range does not extend beyond 300 MHz. These early units are available at low prices and can be used to cover up to 300 MHz with a mechanical dial rather than the frequency counter. Also, practically all CATV converters use the same odd, negative 22-V power supply.
Once the output of the CATV RF module is converted to 10.7 MHz, a log amplifier is required to create the desired display. An excellent and simple device for the purpose is a Motorola IC, the MC3356. This device is designed to function as an FSK receiver for input frequencies in the VHF range for use in radio-control receivers and RF modems.
The IC consists of an oscillator, a mixer, a limiting IF amplifier, a detector. and data shaping and squelch circuits. An interesting feature of this chip is that it has an output designed to be used in a relative signalstrength indicator circuit (see Fig. 3). The output current is proportional to the log of the input-signal amplitude. Although designed to drive a meter, the frequency response of this output is high enough to drive an oscilloscope display in a spectrum analyzer. Using the CATV converter and the MC3356 requires only a sweep-voltage generator and signal-processing circuits to make a complete spectrum analyzer.
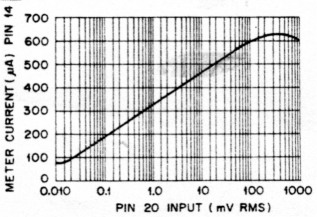
Fig. 3 - Meter current vs. signal Input of the MC3356 wideband FSK receiver. Notice that the meter current is proportional to the log of the Input signal.
Nuts and Bolts
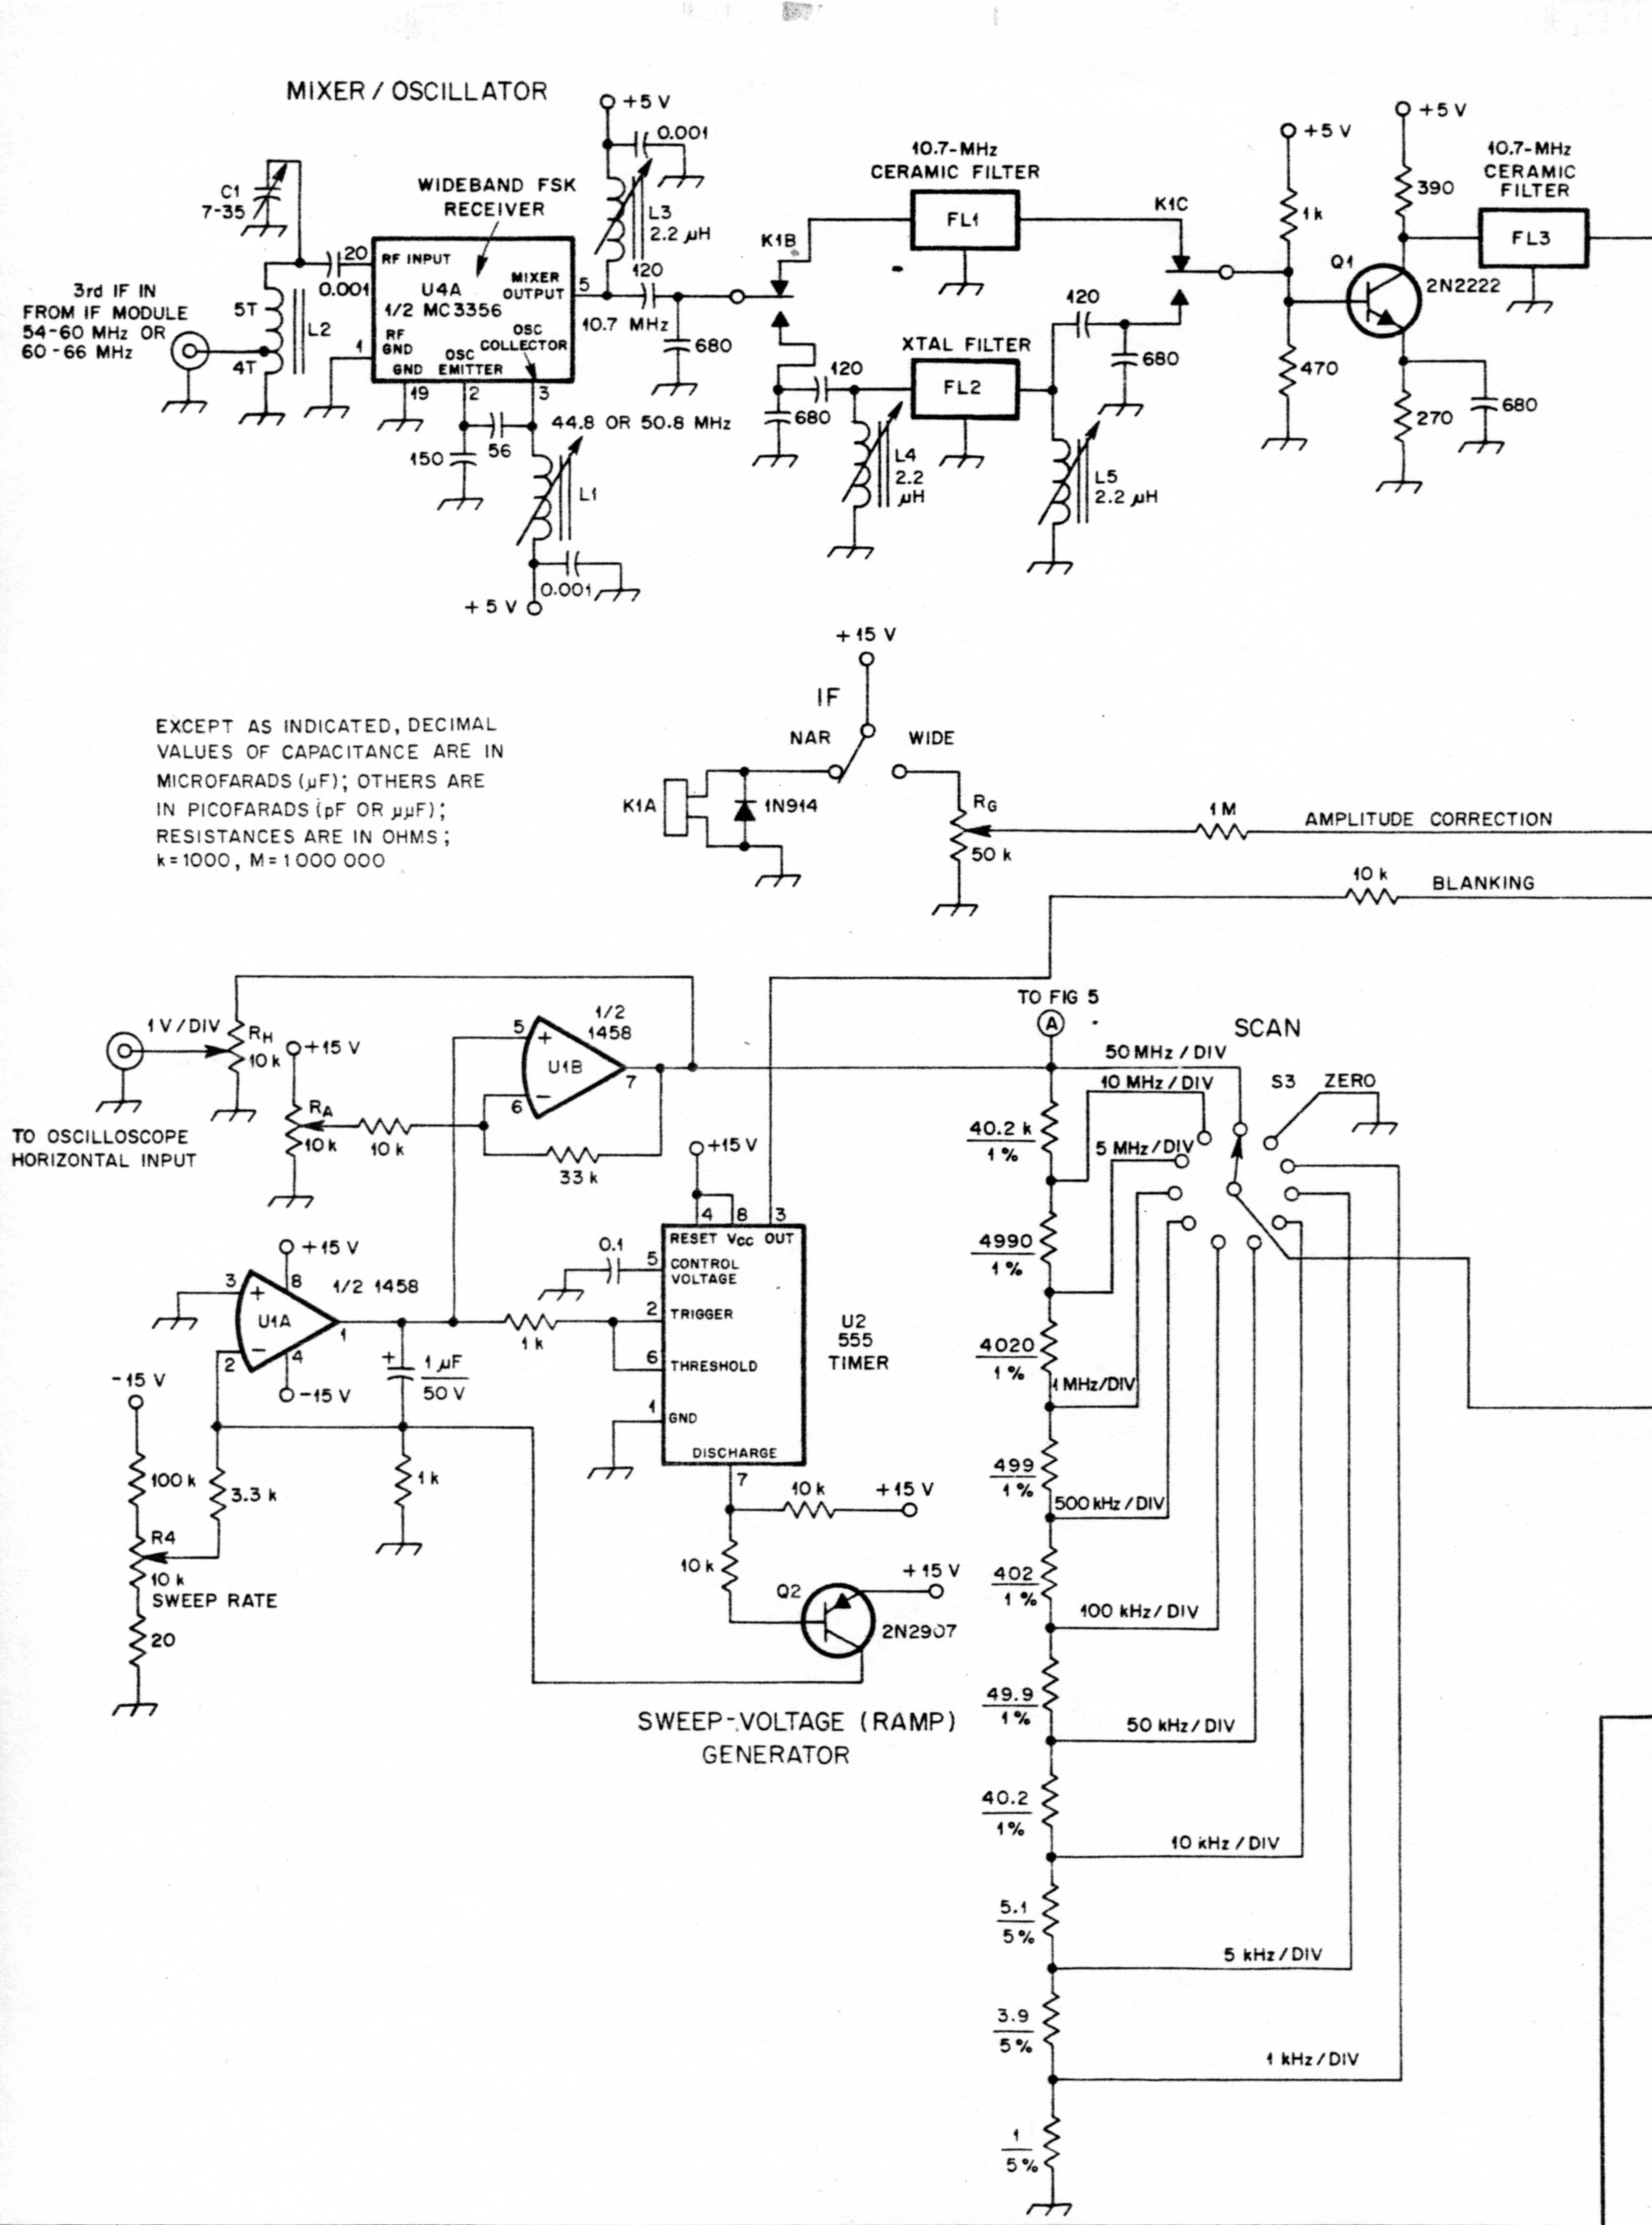
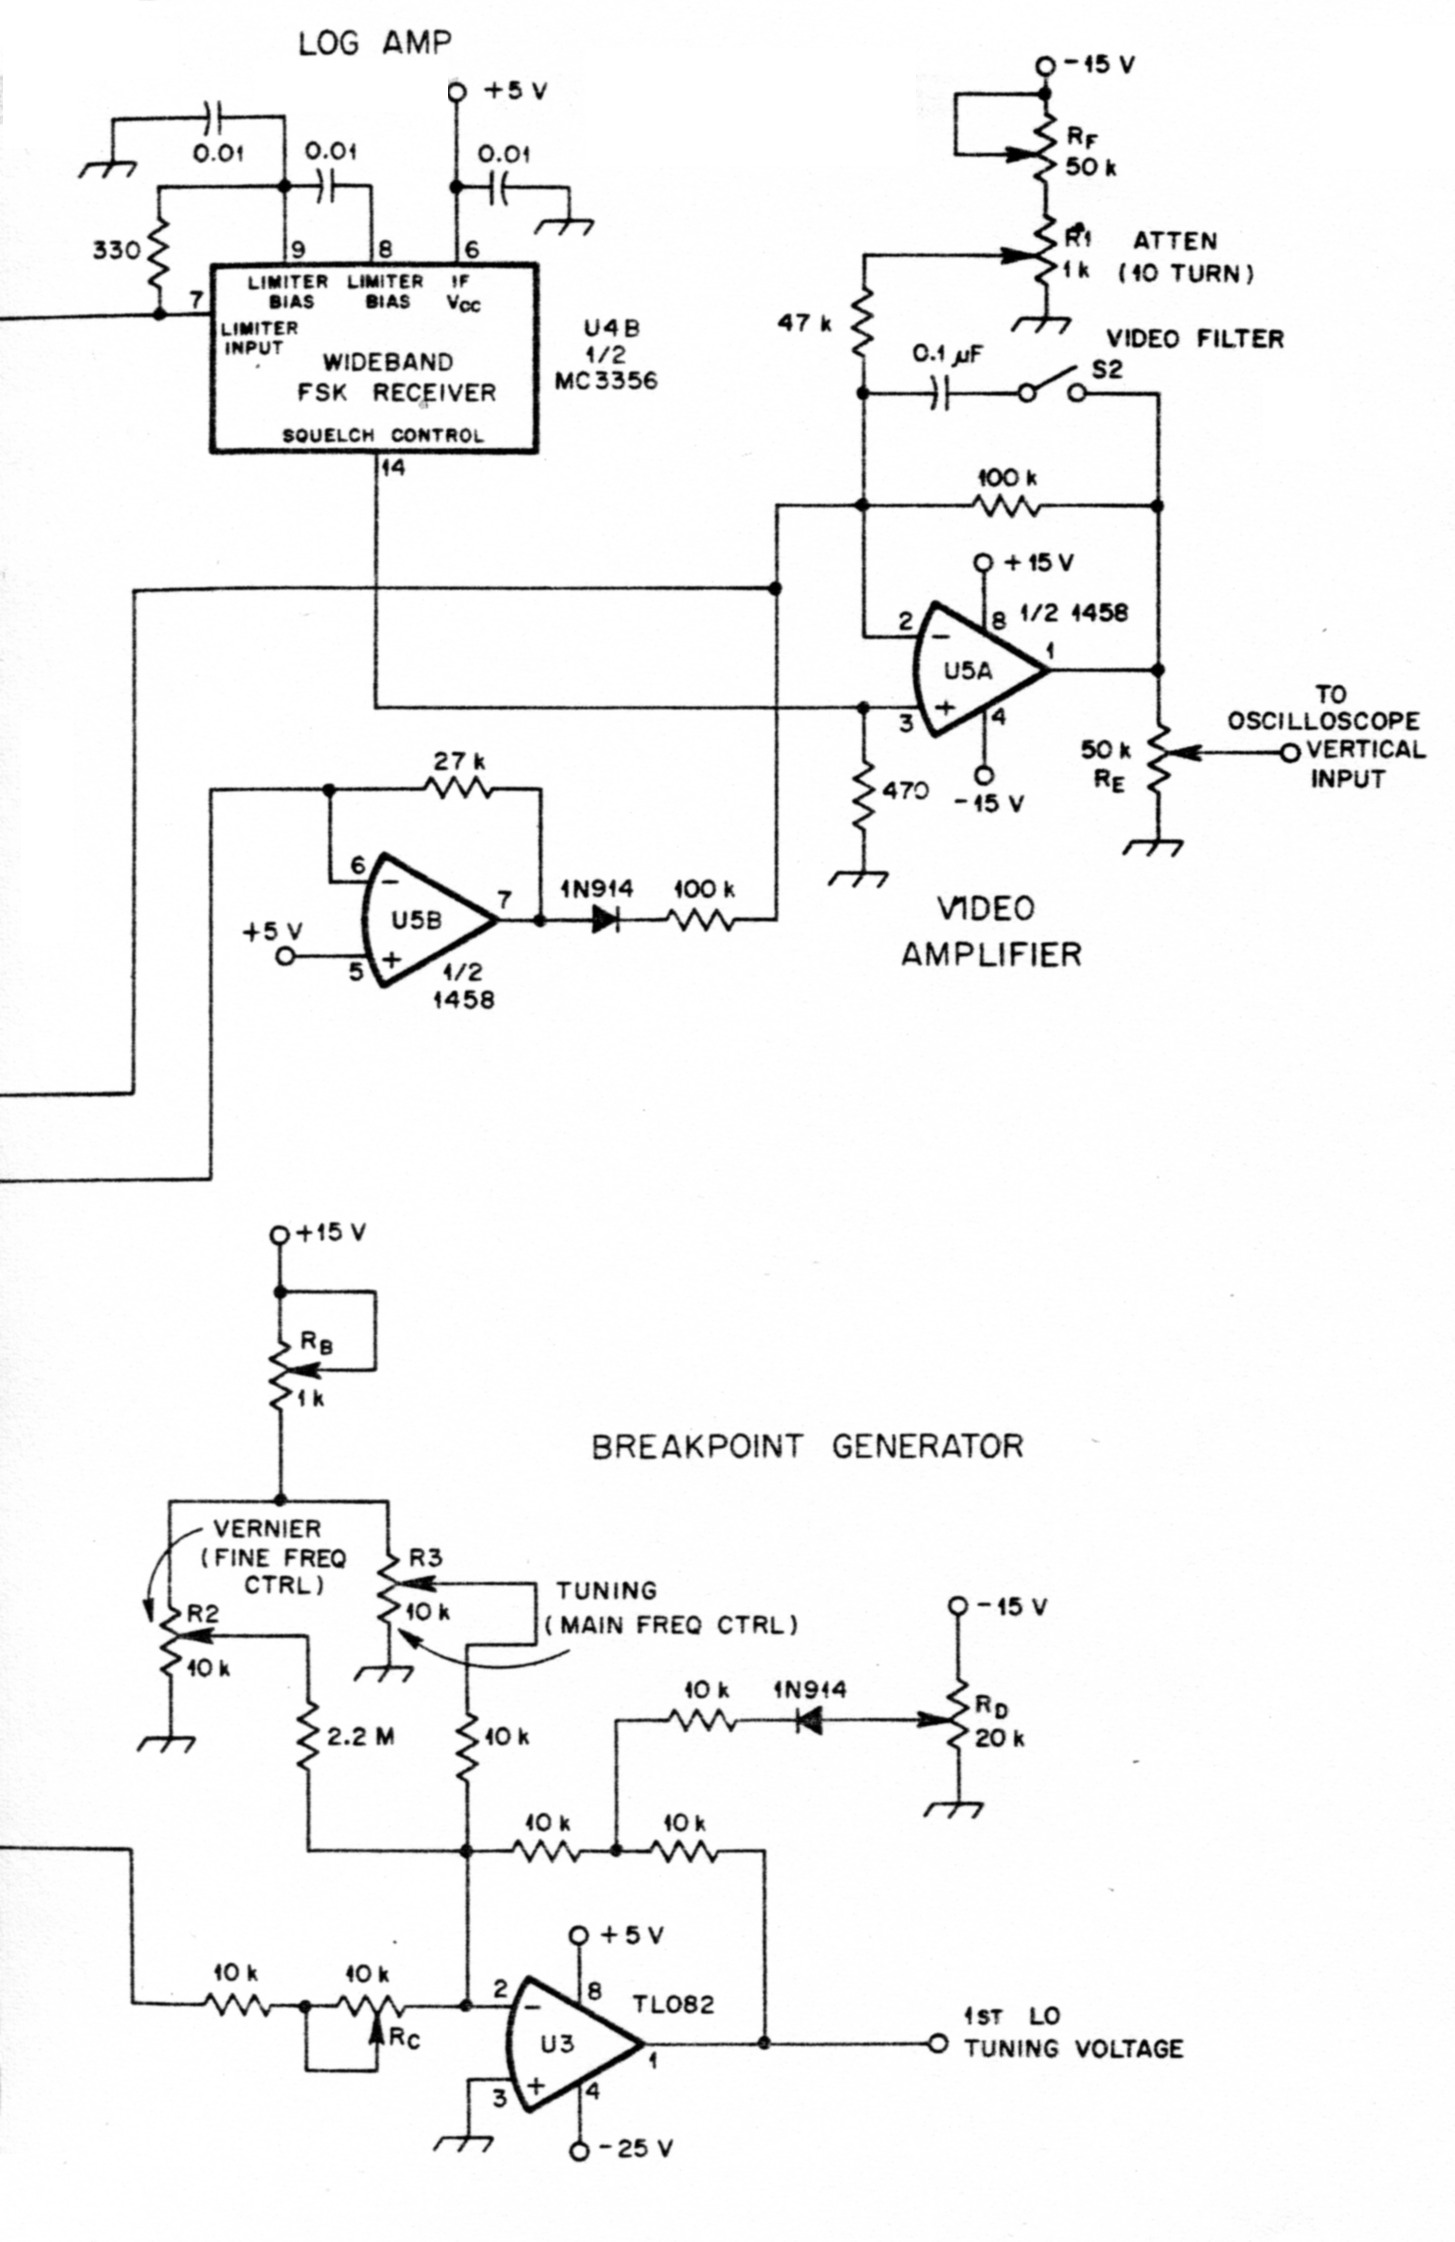
Fig. 4 - Schematic diagram of the main portion of the homemade spectrum analyzer.
| C1 | 7-35 pF miniature ceramic variable. |
| FL1, FL3 | Ceramic IF filter, 10.7 MHz, Murata or Kyocera SFE 10.7-MA or equiv. |
| FL2 | Crystal filter, 10.7 MHz, Piezo Technologies 2195F or equiv. |
| L1 | 250 nH; 51/2 turns, 3/16-diam ferrite slug, Coilcraft 142-05J0. |
| L2 | 9 turns on a Micrometals or Amidon T37-10 core tapped 4 turns from ground end. |
| L3-L5, incl. | 10.7-MHz IF transformer (Mouser Electronics, 421F124). |
| R1 | 1-kΩ, 10-turn potentiometer (see text). |
| R2 | 10-kΩ, single-turn, panel-mount potentiometer. |
| R3 | 10 kΩ, 10-turn, panel-mount potentiometer. |
| R4 | 10 kΩ, single-turn or multitum panel-mount potentiometer. |
| RA | 10 kΩ trimmer. |
| RB | 1 kΩ trimmer. |
| RC | 10 kΩ trimmer. |
| RD | 20 kΩ trimmer. |
| RE | 50 kΩ trimmer. |
| RF | 50 kΩ trimmer. |
| RG | 50 kΩ trimmer. |
| RH | 10 kΩ trimmer. |
| S1 | SPDT toggle. |
| S2 | SPST toggle. |
| S3 | Single-pole, 11-pos. rotary. |
| U1 | MC1458 op amp. |
| U2 | 555 timer. |
| U3 | TL0B2 op amp. |
| U4 | MC3356 wideband FSK receiver. |
| U5 | MC1458 op amp. |
Figs. 4 and 5 show the schematic diagram of the spectrum analyzer. As explained previously, the converter is modified so that the input to the first mixer passes the entire frequency range and is accomplished by removing the high-pass filter at the input. Although the input impedance of the converter module is 75 ohms, it is not necessary to decrease it. Because an attenuator will be used ahead of the RF module, a good 50-ohm match can be obtained simply by providing 10 dB or more of attenuation. It may be necessary to lower the LO frequency to provide complete "0-MHz" coverage, as the lowest input frequency of the original converter is 54 MHz. I did this by heating the solder at one end of the oscillator inductor and pulling approximately 1/8th of an inch of wire from the feedthrough capacitor used as an anchor for the inductor. With a tuning voltage from about 1.5 V to 22 V, the first LO easily covers 516 MHz, or what will appear on the screen as 0 MHz.
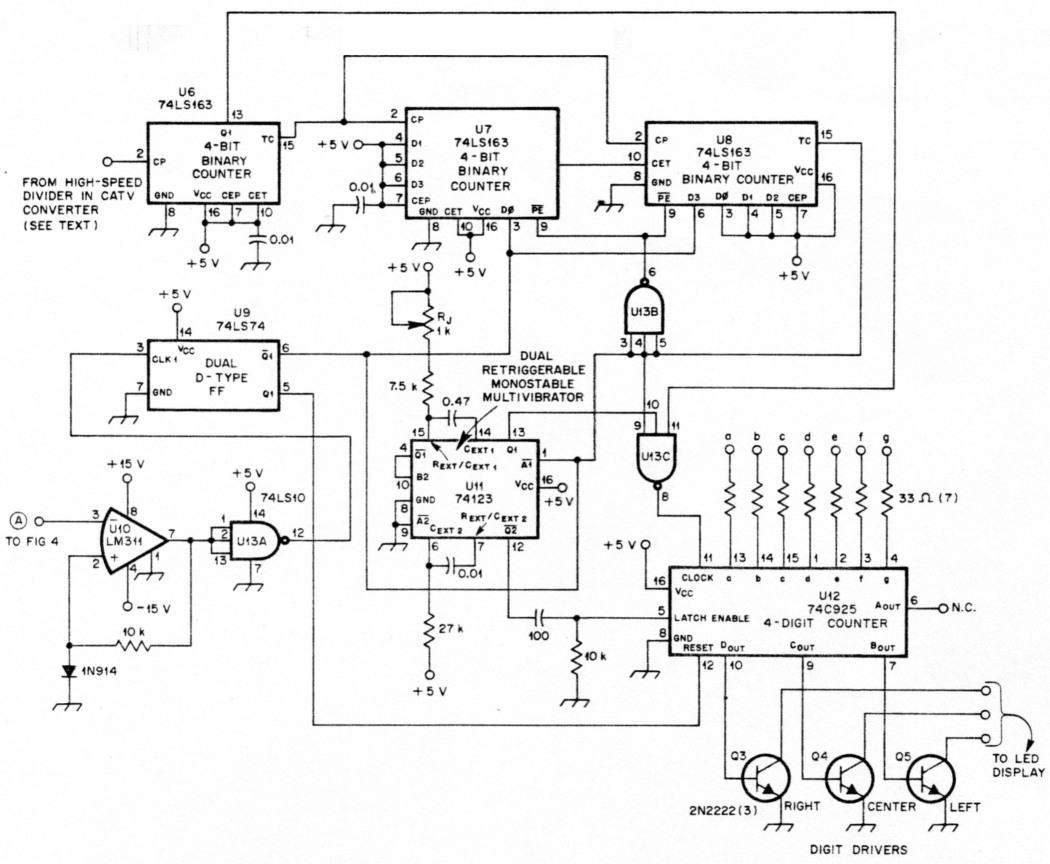
Fig. 5-Schematic diagram of the frequency-divider chain and display section of the spectrum analyzer.
| Q3-Q5, Incl. | 2N2222. |
| RJ | 1 kΩU trimmer, preferably Cermet. |
| U6-U8, incl. | 74LS163 4-bit binary counter. |
| U9 | 74LS74 dual D-type flip-flop. |
| U10 | LM311 voltage comparator. |
| U11 | 74123 dual, retriggerable monostable multivibrator. |
| U12 | 74C925 4-digit counter with multiplexed 7-segment output drivers. |
| U13 | 74LS10 triple 3-input positive NAND gate. |
| Misc. | National NSB5881 multiplexed, common-cathode LED display or equiv. |
Ramp Generator
The frequency change relative to the tuning-voltage change for the first LO is not constant, and a variable-slope input voltage must be provided. A ramp generator is used to provide the sweep voltage for the oscilloscope and the tuning voltage for the first LO. Before being applied to the LO, the ramp voltage is attenuated by the SCAN (MHz/division or dispersion) control and added to a voltage from the front-panel frequency control, then fed to a variable-slope generator. Another significant advantage is evident here. The CATV converter uses a hyperabrupt varactor tuning diode that provides a nearly linear voltage versus frequency slope for the tuning diode, and only one "breakpoint" or change in slope is required. It is not unusual for a spectrum analyzer to use as many as 10 breakpoints in the variable-slope generator, and the simple single-breakpoint slope generator shown in Fig. 4 provides reasonable frequency linearity for the analyzer.
Spurious Responses
While making the converter modifications, do not disturb any of the components within the box even though they may look as if they have been mistreated. Many of the tuned circuits, especially the higher-frequency ones, are tuned at the factory by bending and crushing. When the necessary modifications have been made, the converter cover must be replaced to prevent spurious signals from appearing. This analyzer is capable of viewing signals as low as -105 dBm, and even the smallest gaps can cause spurious responses to appear. Because the cover uses bend-over fasteners, the number of times the cover can be removed and replaced is limited. In my unit, the cover is fastened with small alligator clips (see the accompanying photo). One method of securing the cover is to wrap bare copper wire around the exposed clips.
Frequency Conversion
The TV Channel 2 or 3 output from the converter is mixed with the oscillator of the MC3356 operating at either 50.8 MHz for Channel 3 or 44.8 MHz for Channel 2, and converted to 10.7 MHz. The mixer output feeds a switchable 10.7-MHz filter. The wider of the two filters uses two I0.7-MHz ceramic filters such as those found in FM broadcast receivers. The 3-dB bandwidth of this filter is approximately 200 kHz. A second filter uses a two-pole monolithic filter, like those found in VHF FM receivers such as amateur and monitor receivers. This filter bandwidth is 13 kHz and provides the narrow bandwidth for the analyzer.
The vertical output for the display is derived from the meter output of the MC3356. An op amp circuit provides three functions for the output. First, a dc voltage is summed into the input to provide an IF attenuator function that can be used for small level-difference measurements. Second, a correction voltage is added to compensate for the difference in loss between the narrow- and wide-IF filters.
Finally, a feedback capacitor can be added to provide a video filter for the vertical output.
Attenuator
The input attenuator used in my analyzer was removed from an old sweep generator and provides 60 dB of attenuation in 10-dB steps. The attenuator is accurate to 2 GHz, and is used as a part of the calibration procedure. Not all signal generators have step attenuators and those that do command a high price. A homemade attenuator can be used; such a unit is described in Chapter 25 of The 1986 ARRL Handbook.(3)
Frequency Display
Most of the CATV converters are fre quency synthesized, and most have highspeed prescalers mounted within the RF module. The divided output can be used for a variety of purposes, the most obvious being to interface a frequency synthesizer. Frequency synthesizing a spectrum analyzer is a difficult task as one of the analyzer LOs must be frequency swept. Rather than devise a complex system to allow the analyzer to be synthesized and frequency swept, the output from the high-speed prescaler is used for a frequency counter to display the center frequency. Only three digits of frequency are displayed: 0 to 400 MHz with l-MHz increments, requiring an accuracy of about 0.25% to be accurate to the last digit. This is accomplished with a simple one-shot multivibrator as a simple count gate. The frequency is counted "on-the-fly," which means the frequency is counted as the analyzer is being frequency swept. Even though the frequency is constantly changing, the counting period, 1.024 ms, is short compared to the total sweep time and provides a reasonably accurate frequency measurement.
The spectrum analyzer center frequency is not the actual frequency of the fust LO, but the oscillator frequency minus 516 MHz. Thus, to display the actual operating frequency of the analyzer, 516 must be subtracted from the frequency display. This is done by inhibiting the first 516 pulses from the frequency counter by using a presettable counter. The frequency-measurement period is set to occur at the center of the display by comparing the ramp voltage to zero with a comparator that starts the measurement period.
The analyzer requires several regulated positive and negative voltages. Fortunately, these voltages can be generated by using components from the original converter power supply.
Calibration
Although it is not a difficult procedure, setting up the spectrum analyzer requires some care; an oscilloscope and a frequency counter must be used. The oscilloscope used during alignment can be the same one used as the spectrum-analyzer display, since the display does not have to be connected during alignment. First, determine if all of the analyzer circuits are operating. Check that a ramp voltage of approximately 15 V P-P is available at pin 7 of U1 and that a similar, but inverted, ramp is available at pin 1 of U3, with a maximum amplitude of about 22 V P-P. The ramp amplitude at the latter point should be variable by changing the SCAN switch; the dc offset should be variable depending on the setting of the front-panel frequency control. When the SCAN switch is in the zero position, the output of U3 should be varied with the center frequency control from about - 2 V to about - 22 V. Check the output voltage at pin 1 of U5. There should be some noise visible at this output where the amplitude is a function of the IF and FILTER switches.
Place an oscilloscope probe on pin 7 of U1 and set the SCAN switch to the widest frequency sweep. Adjust RA so that the voltage swing in the positive direction is exactly the same as in the negative direction. Set the frequency of the third LO by adjusting L1 to 50.8 MHz for a Channel 3 converter or 44.8 MHz for a Channel 2 converter. Precise adjustment is not required. A frequency counter can be used to set the third-LO frequency; however, a simple technique, such as listening for the LO on a monitor receiver, is sufficient.
Connect an oscilloscope to the analyzer. Use the X-Y mode with a sensitivity of 1 V per division in the horizontal mode and 50 mV per division in the vertical mode; observe the display. Adjust RH so the horizontal scan is slightly more than the width of the oscilloscope tube. With no input signal, there should be several peaks to the left of the scan. It may be necessary to adjust the front-panel frequency control (TUNING) to observe these peaks. There should be one main peak and a few smaller peaks within a few megahertz of the main peak. This is the IF zero beat and some low-frequency spurious responses, and corresponds with "zero" frequency. Apply a 200-MHz input signal and adjust the input level so the signal is visible. Set the TUNING control to exactly five turns from either end and adjust RB so the 200-MHz signal is exactly at the center of the screen. Adjust the scan-amplitude potentiometer, RC, so the zero-frequency signal is on the left side of the screen. Apply a 400-MHz input signal, which should be close to the right-hand side of the screen. Adjust RC and RD for the best compromise between the 0, 200 and 400-MHz settings.
Attach a frequency counter to the output of the high-speed prescaler. Turn the SCAN control to zero and adjust the TUNING control until the output is exactly 2.797 MHz. Adjust the time-base multivibrator, RJ so the frequency counter reads 200.
Set the SCAN switch to 50 kHz per division and adjust L1 so the 200-MHz signal is centered on the screen. Monitor the output of the high-speed prescaler to be sure that the counter is exactly 2.797 MHz. Sweep the spectrum analyzer slowly and use a short gate time so that the frequency counter will follow the actual frequency of the analyzer. By observing the counter, the precise center frequency can be determined.
Place the SCAN switch in the 10-kHz-perdivision position, place the IF switch at wide, and adjust L3 and C1 for greatest amplitude of the output display. Set the bandwidth to narrow, and adjust L4 and L5 for the best amplitude with only one peak.
Set the IF attenuator to zero, vary the input attenuator in 10-dB steps and adjust RE so the output changes exactly 50 mV for each 10-dB change. Adjust RG so there is no change in the amplitude of the peak of the display between the narrow and wide IF bandwidths. Adjust RF so each turn of the IF attenuator corresponds to a 10-dB change in the displayed-signal level.
Conclusions
The performance of this homemade spectrum analyzer is quite respectable, but it does not have the level of performance that would be available in laboratory instruments. The dynamic range of the instrument is quite good for signals separated by more than about 6 MHz. Signals closer than this fall into the IF-amplifier passband and the second mixer, where the intermodulation is generated. This could be improved by substituting a higher-level IF amplifier transistor and a doubly balanced mixer for the second mixer. I'm sure you'll agree, however, that this analyzer is excellent for almost all Amateur Radio requirements. It will be a welcome addition to your workbench.
Notes
- A limited number of CAN converters and schematic diagrams are available from the author. Send him a large s.a.s.e. for details. PC boards, parts kits and converters for the spectrum analyzer are available from A & A Engineering, 7970 Orchid Dr., Buena Park, CA 90620; tel. 714.521-4160.
- A future article will describe the construction of a matching tracking generator. The tracking generator requires the presence of a prescaler in the spectrum analyzer.
- See pp. 25-43 to 25-45. Complete attenuator kits are available from Circuit Board Specialists, P.O. Box 969, Pueblo, CO 81002; tel. 303 542 5083.
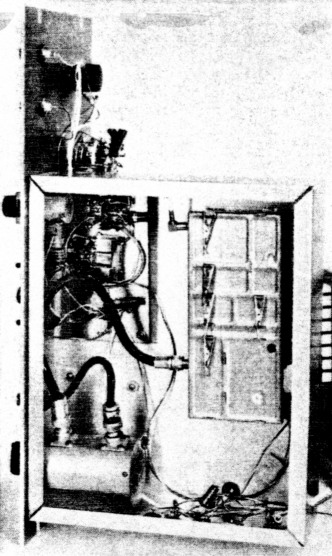
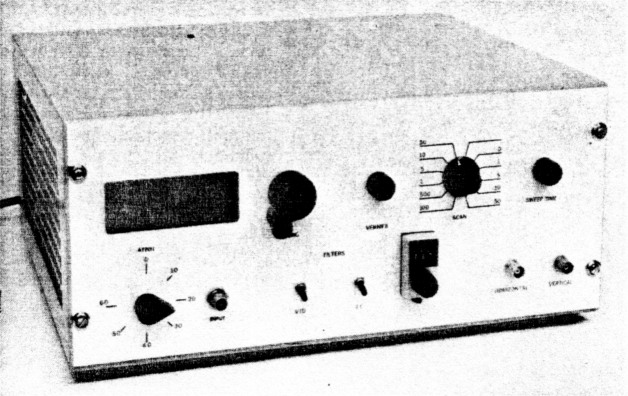
A bottom view of the homemade spectrum analyzer. At the bottom left of the chassis is the input attenuator. The CATV converter module is the large box at the right-hand side of the chassis; small clips secure the cover (see text).
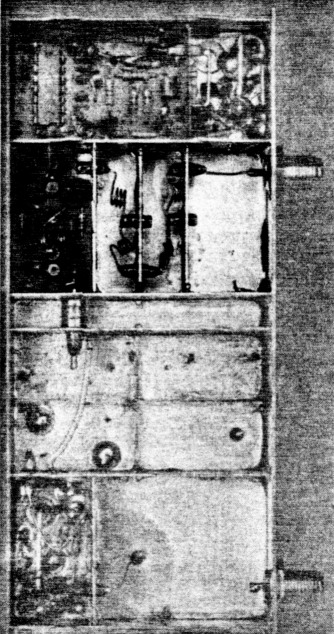
This is an inside view of the CAN module with the high-pass filter removed.
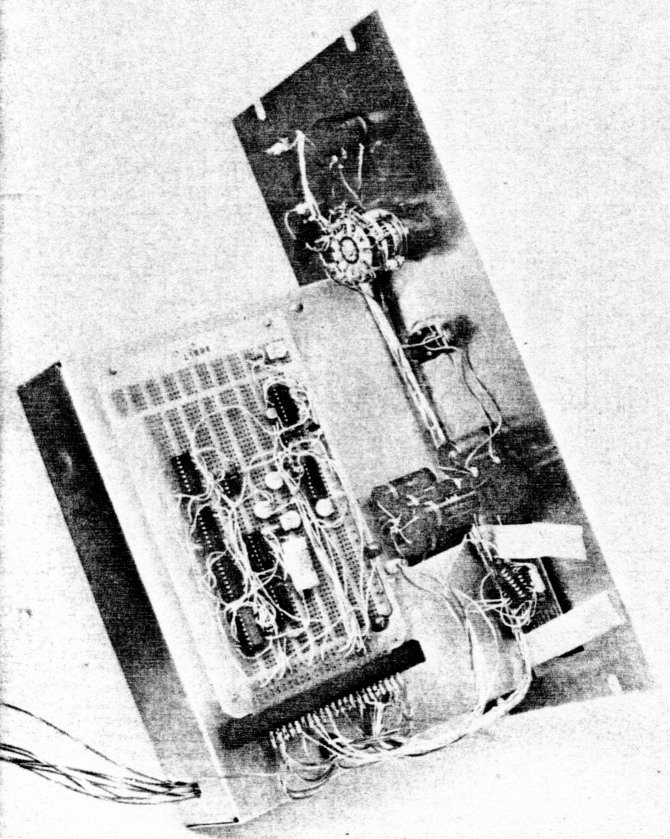
Top view of the prototype spectrum analyzer. The prototyping board carries the frequency divider circuit. Immediately behind the LED display is the counter/driver IC. The power supply is mounted on a separate chassis in the enclosure and is not shown in the photos.
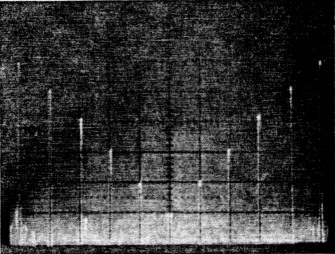
A display produced by the homemade spectrum analyzer. Each horizontal division is 10 MHz; vertical divisions are 10 dB each. The large pip to the left is at 110 MHz; the one to the right, 210 MHz. Two HP 8640B signal generators were connected to the analyzer, each stepped in 10-MHz increments from one end of the frequency range. At each step, the signal amplitude was decreased 10 dB. The photo shows the excellent amplitude and frequency linearity of the homemade analyzer.
K2BLA, Al Helfrick.