Home - Techniek - Electronica - Radiotechniek - Radio amateur bladen - QST - Phase noise and its effects on amateur communications 2
Part 2: Last month, we looked into the causes and effects of phase noise in amateur gear. This month, we'll delve into measurement of phase noise, both at home and in the lab.
In part 1 of this article, I discussed the causes and effects of phase noise in amateur communications systems.(1) This month, procedures used for measuring both receiver and transmitter phase noise will be discussed.
Measuring Receiver Phase Noise
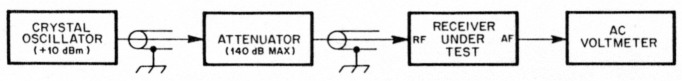
Fig 6-Block diagram of test setup for measuring the SSB phase noise of an SSB or CW receiver.
A block diagram of my receiver phase-noise measurement setup is shown in Fig 6. The test setup consists of an oscillator, a step attenuator and an ac voltmeter. The output of the oscillator is fed through the attenuator to the receiver's RF input. The ac voltmeter is connected to the audio output of the receiver. The receiver is operated in SSB or CW mode with the AGC disabled.
The oscillator and step attenuator must be carefully constructed (well shielded, minimum necessary lead lengths, and so on) for proper operation of this test setup.(2) The oscillator provides the reference signal for measuring phase noise. The phase noise of the oscillator must be less than that of the receiver if we are to measure receiver phase noise accurately. The oscillator should have a power output of at least + 10 dBm (10 mW) into 50 Ω. Less power than this may limit the accuracy of the measurement setup at low phase-noise levels. The oscillator should be constructed in a metal box and powered by an internal 9-V battery to minimize unwanted signal leakage.
The step attenuator must have a maximum attenuation of at least 140 dB. Preferably, it should be adjustable in 1-dB steps. It is difficult to design a single attenuator circuit that provides this much attenuation, so a step attenuator with a maximum of 60 6r 70 dB of attenuation should be used in series with fixed attenuators to obtain the maximum value.
A design for a suitable step attenuator is given in The ARRL Handbook.(3) Each of the fixed attenuators can be constructed in a shielded enclosure using standard pi or T resistor configurations to achieve the desired attenuation.' Use BNC connectors on the oscillator and step attenuator; they have better shielding properties than UHF connectors. Commercial step attenuators and in-line coaxial attenuators are sometimes available on the surplus market. If you choose to build attenuators, use 5% (or better) precision resistors. The accuracy of the phase-noise measurements depends to a great extent on the accuracy of the attenuators.
The ac voltmeter is used to measure the audio output level from the receiver. The voltmeter should measure true RMS voltage, but commonly available peak-reading ac voltmeters are adequate for this application.
Phase-noise measurements are done on the band for which the oscillator is built. Measurements should be made in each amateur band, since phase-noise levels of many receivers vary from one amateur band to another. Briefly, the measurement procedure is as follows: A reference audio output level is established by tuning the receiver to the oscillator frequency and measuring the audio output voltage. The receiver is then tuned above (or below) the oscillator frequency in increments of the desired offset frequency. The attenuation is then decreased until the noise voltage at the audio output is the same as the reference level. The difference in the two attenuator settings is then corrected for the receiver bandwidth to give the SSB phase noise at that offset frequency. The process is then repeated for several different offset frequencies. Now we'll go through the measurement procedure step by step.
Step-By-Step Measurement Procedure
1) Connect the test equipment as shown in Fig 6. Set the step attenuator to its maximum attenuation. Switch the oscillator out of the line. Set the receiver for SSB or CW reception with the AGC disabled. Preamplifiers or input attenuators in the receiver should be disabled, if possible. Use the narrowest IF bandwidth available in the receiver. Set the RF and AF gain controls to maximum, unless this causes the audio amplifier to overload from receiver noise. In case of audio-amplifier overload, reduce the audio gain until there is a minimum of 10 dB of headroom in the audio amplifier. This can be done by decreasing the AF gain (while monitoring audio output voltage) by 10 dB after all signs of gain compression disappear. In other words, decrease the AF gain to 10 dB below the point at which the audio output voltage begins to vary linearly with adjustment of the AF gain control.
2) Determine the 6-dB bandwidth of the receiver. An easy way to do this is to enable the oscillator, tune the oscillator signal through the receiver passband and note the requencies at which the audio voltage is dB below the peak response. The deference between the upper and lower frequencies is the receiver's bandwidth. Alternatively, the published 6-dB bandwidth for the receiver can be used. The bandwidth measurement doesn't have to be very accurate-a 25% error in the bandwidth factor affects the phase-noise measurement by only 1 dB. Record the receiver bandwidth (Δf).
3) Switch the oscillator into the line. Center the oscillator signal in the receiver passband. Switch the oscillator out of the line and measure and record the audio output voltage. Switch the oscillator into the line again and adjust the step attenuator until the audio voltage increases by 41% (3 dB) from the no-signal value. The signal is now at the receiver's MDS (minimum discernible signal) level. This setting is a corn-promise: A higher setting allows more precise measurement of the audio output boltagz; a 1ostiet setting decreases the possibility of overloading the receiver front end. Record the frequency to which the receiver is tuned (fo), the setting of the step attenuator (A0), and the audio output voltage (V0).
4) Measure the phase noise by first tuning the receiver to the desired offset frequency, given by fo + f, where f is the offset frequency. Then, adjust the attenuator until the audio output voltage is as close as possible to (V0). Record the total attenuation (At) and the audio voltage (V1). The SSB phase noise at this offset frequency is found by
![]()
where L(f) = SSB phase noise in dBc/Hz.
5) Determine if the receiver is overloaded at this offset frequency as follows: Decrease the attenuation by 3 dB. Note the audio voltage at the new attenuator setting (V2). The audio output voltage of the receiver should increase by approximately 22% (1.7 dB) from V1. If it increases by less than 18% (1.4 dB), it is likely that some stage in the receiver is overloaded, and the SSB phase-noise measurement is inaccurate. If the overload is in the audio stages, it can be eliminated by decreasing the audio gain and repeating the measurements. If the overloading is occurring in the RF or IF stages, the receiver's blocking dynamic range has been exceeded. The overload may be eliminated by reducing the receiver's RF gain and repeating the measurements. The existence of this problem indicates that, at this offset frequency, the receiver's performance is limited by blocking dynamic range, not phase noise.
6) Repeat steps 4 and 5 for several offset frequencies. Ideally, measurements should be made at offset frequencies separated by no more than half of the receiver's bandwidth, in order to make sure that no discrete phase-noise components are overlooked. This is tedious at the greater offset frequencies. Generally, a coarser sampling is adequate to plot the phase-noise curve, as long as you check the intermediate offset frequencies to make sure that no discrete signals are present. The measurements can start at offset frequencies as close as a few times the receiver's bandwidth, if the receiver has good IF filters. You can determine if the offset is too small by disconnecting the audio voltmeter from the receiver and listening to the audio. If you can hear the carrier signal at all, the offset is too small. All that should be present is noise, if the measurement is to be accurate. Increase the offset until no trace of carrier remains in the audio to be sure.
The measurement technique outlined in the steps above is quite accurate. SSB phase-noise levels of less than -160 dBc/Hz can be measured on a receiver that has good sensitivity and a high gain-compression point (good dynamic range), as determined in step 5. It is difficult to construct an oscillator that has a noise floor much below this level and, as mentioned earlier, the oscillator phase-noise level limits the accuracy of the measurement setup.
This measurement technique has advantages and disadvantages. One of its major advantages is that it measures the apparent phase noise of the receiver. Apparent phase noise includes the effects of filters; it is the phase noise that actually limits a receiver's dynamic range.
One disadvantage of this measurement technique is that it doesn't allow direct measurement of the phase noise of an oscillator. Therefore, it can't be used to directly measure the phase noise of a transmitter. This limitation can be overcome by using a receiver with known phase-noise characteristics to measure the phase noise of a transmitter. The transmitter is substituted for the oscillator in the test setup, and its output is attenuated to the power level of the oscillator. As long as the transmitter phase noise is greater than that of the receiver, measurements of the transmitter's phase noise will be accurate.
Another disadvantage is that, at some offset frequencies, the receiver's dynamic range may make phase-noise measurement impossible. Precision in this measurement technique requires that the oscillator output be variable from a very low level to a very high level, in small, precise steps.
| Oscillator output power = -3 dBm (0.5 mW) Receiver bandwidth (At) = 1.8 kHz Audio noise voltage = 0.070 V | |||||
| Audio reference voltage (Vo) = 0.105 V | |||||
| Reference attenuation (A0) = 121 dB | |||||
| Offset Frequency (kHz) | Attenuation (A1) (dB) | Audio V1 (volts) | Audio V2 (volts) | Ratio V2/V1 | SSB Phase Noise (dBc/Hz) |
|---|---|---|---|---|---|
| 4 | 35 | 0.102 | 0.122 | 1.20 | -119 |
| 5 | 32 | 0.104 | 0.120 | 1.15 | -122* |
| 6 | 30 | 0.104 | 0.118 | 1.13 | -124* |
| 8 | 27 | 0.100 | 0.116 | 1.16 | -127* |
| 10 | 25 | 0.106 | 0.122 | 1.15 | -129* |
| 15 | 21 | 0.100 | 0.116 | 1.16 | -133* |
| 20 | 17 | 0.102 | 0.120 | 1.18 | -137 |
| 25 | 14 | 0.102 | 0.122 | 1.20 | -140 |
| 30 | 13 | 0.102 | 0.122 | 1.20 | -141 |
| 40 | 10 | 0.104 | 0.124 | 1.19 | -144 |
| 50 | 8 | 0.102 | 0.122 | 1.20 | -146 |
| 60 | 6 | 0.104 | 0.124 | 1.19 | -148 |
| 80 | 4 | 0.102 | 0.126 | 1.24 | -150 |
| 100 | 3 | 0.102 | 0.126 | 1.24 | -151 |
| 150 | 3 | 0.102 | 0.124 | 1.22 | -151 |
| 200 | 0 | 0.104 | -154 | ||
| 250 | 0 | 0.100 | -154 | ||
| 300 | 0 | 0.098 | < -154 | ||
| 400 | 0 | 0.096 | < -154 | ||
| 500 | 0 | 0.096 | < -154 | ||
| 600 | 0 | 0.097 | < -154 | ||
| 800 | 0 | 0.096 | < -154 | ||
| 1000 | 0 | 0.096 | < -154 | ||
| Asterisks indicate measurements possibly affected by receiver overload (see text). | |||||
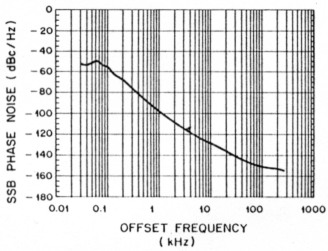
Fig 7-Measured SSB phase noise of an ICOM IC-745 transceiver (serial number 01528).
Table 3 and Fig 7 show the phase-noise characteristics I measured in the receiver section of my ICOM IC-745 transceiver using this method. Table 3 includes the attenuation and voltage values to show their relationships to phase-noise levels in my IC-745 over this range of offset frequencies. The data obtained from the ratio of V2 to V1 indicates that the receiver was probably overloaded at offset frequencies from 5 kHz to 15 kHz. This measurement was limited to an SSB phase-noise floor of - 154 dBc/Hz because of the low power-output level of the oscillator. Fig 7 is based on the far-out phase noise data obtained from Table 3, as well as the close-in phase noise measured using laboratory test equipment and the same 1C-745. The data obtained using the method described earlier and that obtained from the laboratory test equipment closely track each other. The phase-noise performance of this transceiver generally exceeds that indicated by the "good" curve in Fig 5 of part 1 of this article.
Conclusion
Close-in phase noise generally has little effect on the performance of amateur communications systems. However, far-out phase noise can significantly reduce the dynamic range of a receiver. Far-out phase-noise performance has effects just as critical as blocking dynamic range and two-tone dynamic range performance of receivers. Ideally, these measurements should be made for a range of offset frequencies. Far-out phase noise in receivers can be measured with relatively inexpensive test equipment, as long as care is taken to perform the measurements properly.
Notes
- Part 1 appeared in Mar 1988 QST, p 14-20.
- A simple oscillator circuit suitable for use in this application appears in W. Hayward and D. DeMaw, Solid State Design for the Radio Amateur, 2nd printing (Newington: ARRL, 1986), p 126, Fig 26.
- M. Wilson, Ed., The ARRL Handbook, 1988 edition (Newington: ARRL, 1987), p 25-43.
- Component values and construction information for fixed attenuators are given in The ARRL Handbook, 1988 edition, p 25-44.
Transmitter Phase-Noise Measurement in the ARRL Lab
Last month, the technique used in the ARRL lab to measure transmitter phase noise was introduced briefly. The system essentially consists of a direct-conversion receiver with very good phase-noise characteristics. As shown in Fig A, we use an attenuator after the,transmitter, a Mini-Circuits ZAY-1 mixer, a Hewlett-Packard 8640B signal generator, a band-pass filter and an audio-frequency spectrum analyzer (HP 8556A/8552B) to make the measurements.
The transmitter signal is mixed with the output of the signal generator, and signals produced in the mixing process that are not required for the measurement process are filtered out. The spectrum analyzer then displays the transmitted phase-noise spectrum. The 100 mW output of the HP 8640B is barely enough to drive the mixer-the setup would work better with 200 or even 400 mW of drive. To test the phase noise of an HP 8640B, we use a second '8640B as a reference source. It is quite important to be sure that the phase noise of the reference source is lower than that of the signal under test, because we are really measuring the combined phase-noise output of the signal generator and the transmitter. It would be quite embarrassing to publish phase-noise plots of the reference generator instead of the transmitter under test! The HP 8640B has much cleaner spectral output than most transmitters.
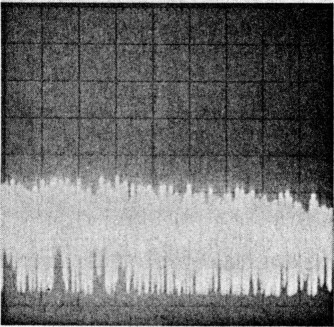
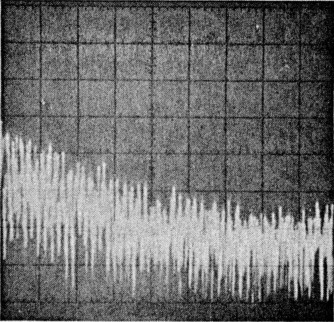
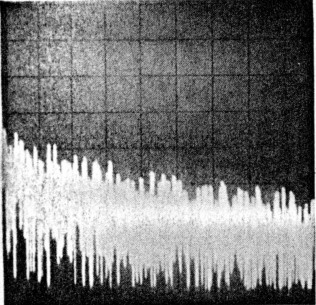
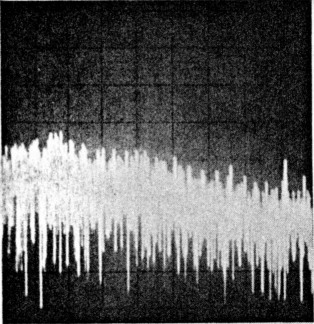
As in the sidebar, "Phase-Noise Photographs from the ARRL Lab," in part 1 of this article, phase-noise photographs for several popular amateur transceivers are shown. All photographs were taken directly from the spectrum-analyzer display, using the test setup shown in Fig A. These photos do not necessarily reflect the phase-noise characteristics of all units of a particular model.
The log reference level (the top horizontal line on the scale in the photos) represents -60 dBc/Hz. It is common in industry to use a 0-dBc log reference, but such a reference level would not allow measurement of phase-noise levels below - 80 dBc/Hz. The actual measurement bandwidth used on the spectrum analyzer is 100 Hz, but the reference is scaled for a 1-Hz bandwidth. This allows phase-noise levels to be read directly from the display in dBc/Hz. Because each vertical division represents 10 dB, the photos show the noise level between -60 dBc and -140 dBc. The horizontal scale is 2 kHz per division. The offsets shown in the photos are 2 through 20 kHz.
What do the Phase-Noise Pictures Mean?
Although they are useful for comparing different radios, Figs B-E can also be used to calculate the amount of interference you may receive from a nearby transmitter with known phase-noise characteristics. An approximation is given by
Interfering signal level = NL + 1- × Log(BW) (Eq A)
where
Interfering signal level is in dBc
NL is the noise level on the receiving frequency
BW is receiver IF bandwidth in Hz
For instance, if the noise level is - 90 dBc and you are using a 2.5-kHz SSB filter, the interfering signal will be -56 dBc. In other words, if the transmitted signal is 20 dB over S9, and each S unit is 6 dB, the interfering signal will be as strong as an S3 signal.
The measurements made in the ARRL lab apply only to transmitted signals. Because we do not have computer-controlled instrumentation, it is not practical to make the large number of measurements necessary to evaluate receiver phase noise more precisely than author Grebenkemper's setup allows. It is reasonable to assume that the phase-noise characteristics of most transceivers are similar on transmit and receive, because the same oscillators are generally used in the local-oscillator (LO) chain.
In some cases, the receiver may have better phase-noise characteristics than the transmitter. Why the possible difference? The most obvious reason is that circuits often perform c. less than optimally in strong RF 'fields, as anyone who has experienced RFI problems can tell you. A less-obvious reason results from the way that many high-dynamic-range receivers work. To get good dynamic range, a sharp crystal filter is often placed immediately after the first mixer in the receive line. This filter removes all but a small slice of spectrum for further signal processing. If the desired filtered signal is a product of mixing an incoming signal with a noisy oscillator, signals far away from the desired one can end up in this slice. Once this slice of spectrum is obtained, however, unwanted signals cannot be reintroduced, no matter how noisy the oscillators used in further signal processing. As a result, some oscillators in receivers don't affect phase noise.
The difference between this situation and that in transmitters is that crystal filters are seldom used for reduction of phase noise in transmitting because of the high cost Involved. Equipment designers have enough trouble getting smooth, click-free break-in operation in transceivers without having to worry about switching crystal filters in and out of circuits at 40-WPM keying speeds!
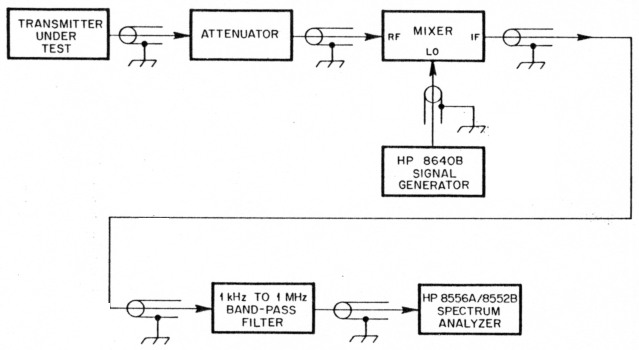
Fig A - ARRL transmitter phase-noise measurement setup.
 |
 |
|
| Fig B - Kenwood TS-940S (serial number 7050361) phase-noise characteristics. Measurement frequency: 3.5 MHz, power output: 127 W. | Fig C - ICOM IC-745 (serial number 03101) phase-noise characteristics. Measurement frequency: 3.5 MHz, power output: 100 W. | |
 |
 |
|
| Fig D-Kenwood TS-440S (serial number 7051669) phase-noise characterisj tics. Measurement frequency: 3.5 MHz, power output: 104 W. | Fig E-Ten Tec Corsair Il (serial number 58001721) phase-noise characteristics. Measurement frequency: 14 MHz, power output: 103 W. |
KH6CP, Zack Lau.
KI6WX, John Grebenkemper.
1 - 2