1 kW PEP power meter
A meter to measure PE power is very useful. This circuit using a LED Bar graph can be built in two forms and can set-up for either 1 kW or 150 Watts full scale.
The simpler form provides a dot display with a slow decay showing peak power.
The more complex circuit provides, in addition to the dot display, a bar which indicates the instantaneous output. The meter has an attack time of less than 1 ms and holds the reading in DOT mode. The ranges are 5-150, 150-500 and 500-1050 Watts on 50 or 75 ohms.
The unit is simple to construct and can be fitted into a small plastic box, 82x52x30 millimeters. The probe is contained in a metal box from 30x30x60 millimeters to 40x40x60 millimeters or similar, fitted with a male UHF plug (RG8) and connected to the transmitter through a UHF Tee adaptor.
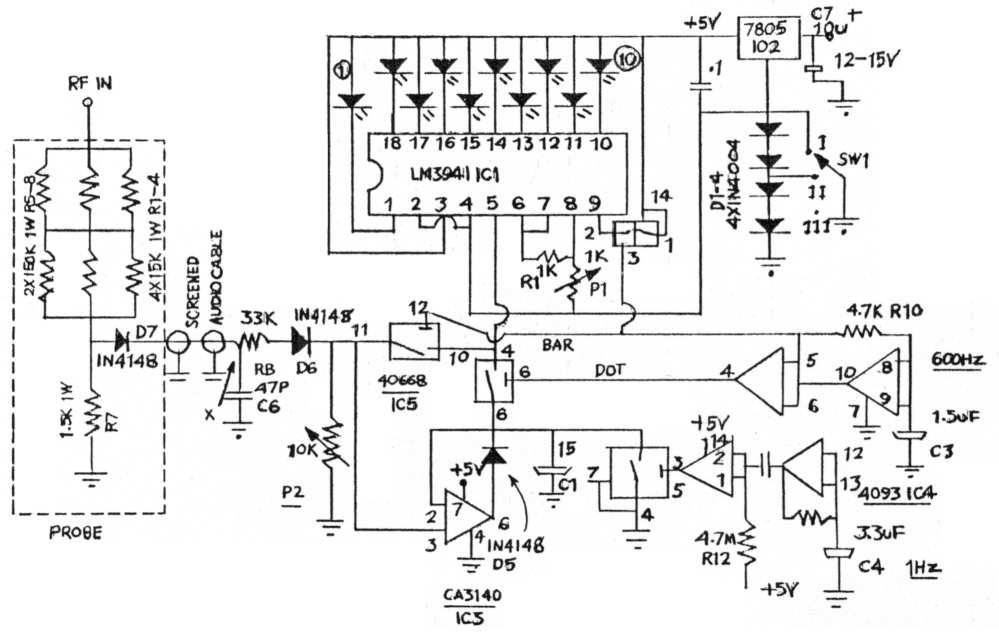
Figure 1: 1 kW PEP meter
Description
IC1 is a linear LED driver operated in DOT and BAR mode. D1-4 provide two steps of approximately 1.4 volts for two ranges. P1 sets FSD of IC1 to approximately 1.4 volts (two diodes.) R9 sets the LEDs current (12mA). IC5 (4066B) has four individual switches which change IC1 from DOT and BAR mode at 600 Hz rate and discharge C1. IC3 (op amp), D5 and C1 provide hold-in-DOT mode. D6 and D7 provide offset voltage drop for the first LED of IC1. IC4 (4093) is quadruple Schmidt trigger, two sections are used as a 600 Hz square wave oscillator to operate IC5, two other sections are used to produce 6 ms + ve pulse at 1 Hz rate to discharge C1. R1-6 and R7 is RF voltage divider. R5-6 are frequency compensation. R1-7 are one watt carbon film resistors.
Frequency response is flat from 3.5 to 28 MHz. Since the meter reads RF voltage, indication will depend on the SWR. Diodes D1-4 are power diodes, 1 N4004 or similar, selected for identical forward voltage drops at 10 mA. Cl, C3, and C4 are tantalum capacitors. P1 and P2 are miniature 10 turn vertical pots, for ease of adjustment.
DC calibration
Set P1 for 0 ohms, P2 for maximum resistance. Connect a variable DC power supply through a 1 N4148 to point X (the RF probe is not connected at this stage.) Set SW1 to range II, and increase voltage input until first LED just lights up. Measure the voltage with a digital voltmeter and make a note of it. Change SW1 to range I, and adjust P1 until the 10th LED just lights up. Check that the voltage is the same for the 10th LED on range II as for the first LED on rage III. If D1-4 are identical it will be the same.
RF calibration
Connect the transmitter, via the reference power meter, to a dummy load. Connect the probe to the output of the transmitter or dummy load via a Tee adaptor, SW1 range I. Increase power on any band, to 100 watts and adjust P2 to light up the eighth LED. It can be calibrated for 50 or 75 ohms as required. In case the output of the probe is too low, you can reduce R8 to 22 k ohms.
If on high input, during DC calibration, the display locks-up (that is, the 10th LED stays on), changeover the input/output of the IC5 section used to discharge C1. In my case, pin 11 to ground was locking-up, causing the 10th LED to stay on. Swapping around solved the problem. Other sections of the IC5 used to switch BAR and DOT might also cause problems in a similar manner.
A 10 LED bargraph display was used in this model and is readily available from Jaycar and Altronics.
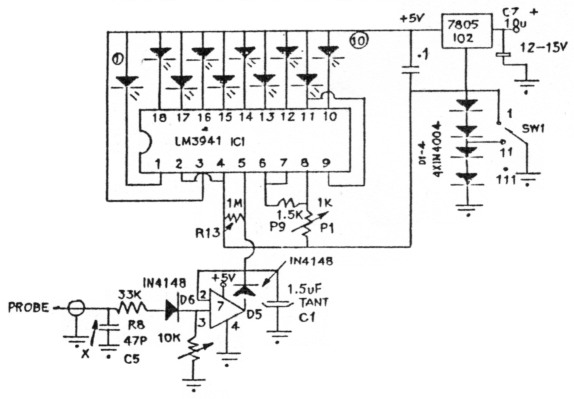
Figure 2: Simple DOT Decay 1 kW Meter
150 Watt PEP meter
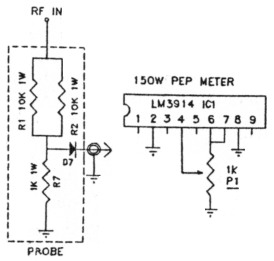
Figure 3: 150 Watt Meter
The meter is identical to the 1 kW version (except that D1-4 and SW1 are omitted). The probe is smaller and P1 is in different positions as shown on the circuits. P1 is used to offset voltage drop of D7.
C1 is 10µF tantalum for the DOT and BAR display. The probe is made of the same type resistors as the other version, and are installed in a metal box 25x25x50 millimeters OD (Sucobox by Suhner, or similar). The frequency response is a flat 3.5 to 30 MHz.
DC calibration
Set the arm of P1 to ground. Connect a variable DC power supply through a 1N4148 to point X. Adjust P2 for the 10th LED to just light up at one fifth voltage shown in the table for that LED. Repeat the process.
RF calibration
Connect all as for the 1 kW meter. Increase CW power to 100 watts, adjust P2 for the eighth LED to just light. Check that the first LED lights for five watts in. If not, adjust P1. Repeat the process.
| Range I | ||||
|---|---|---|---|---|
| 50 ohm | 75 ohm | |||
| LED | W | V | W | V |
| 1 | 5 | 15.8 | 5.0 | 19.4 |
| 2 | 10 | 23.7 | 11.2 | 29.0 |
| 3 | 20 | 31.6 | 20.0 | 38.7 |
| 4 | 30 | 39.5 | 31.2 | 48.4 |
| 5 | 45 | 47.4 | 45.0 | 58.1 |
| 6 | 60 | 55.3 | 61.2 | 67.7 |
| 7 | 80 | 63.2 | 80.0 | 77.5 |
| 8 | 100 | 71.1 | 101.0 | 87.0 |
| 9 | 125 | 79.0 | 125.0 | 96.8 |
| 10 | 150 | 86.9 | 151.0 | 106.4 |
| Range II | ||||
| 50 ohm | 75 ohm | |||
| LED | W | V | W | V |
| 1 | 150 | 86.9 | 151.0 | 106.4 |
| 2 | 180 | 94.8 | 179.7 | 116.1 |
| 3 | 210 | 102.7 | 210.9 | 125.8 |
| 4 | 245 | 110.6 | 244.6 | 135.4 |
| 5 | 280 | 118.5 | 280.8 | 145.1 |
| 6 | 320 | 126.4 | 319.5 | 154.8 |
| 7 | 360 | 134.3 | 360.7 | 164.5 |
| 8 | 400 | 142.2 | 404.4 | 174.2 |
| 9 | 450 | 150.1 | 450.6 | 183.8 |
| 10 | 500 | 158.0 | 499.3 | 193.5 |
| Range III | ||||
| 50 ohm | 75 ohm | |||
| LED | W | V | W | V |
| 1 | 500 | 158.0 | 499.3 | 193.5 |
| 2 | 550 | 165.9 | 550.5 | 203.2 |
| 3 | 600 | 173.8 | 604.1 | 212.9 |
| 4 | 660 | 181.7 | 660.3 | 222.5 |
| 5 | 720 | 189.6 | 719.0 | 232.2 |
| 6 | 780 | 197.5 | 780.1 | 241.9 |
| 7 | 840 | 205.4 | 843.8 | 251.6 |
| 8 | 910 | 213.3 | 909.9 | 261.2 |
| 9 | 980 | 221.2 | 978.6 | 270.9 |
| 10 | 1050 | 229.1 | 1049.7 | 280.6 |
VK4AOI, Frank Antonovic.