Effective noise temperature 2
Equivalent noise temperature and nf
Understanding optimum noise performance
In "Effective Noise Temperature, Part 1," I gave an introduction to and background on the concept of effective noise temperature. Part 2 picks up the discussion of the limiting value of source voltage, and goes on to talk about noise figure phenomena and amplifier equivalent noise temperature.
When the source in the small signal example in part 1 is fed to a matched 50-ohm load, the load signal and noise voltages are each, 0.561 µV. The power delivered to the load is 6.29 x 10⁻¹⁵ watts. That is precisely the power you'd expect to be available to a matched load from a room temperature resistive source and π/2-MHz noise bandwidth using Equation 1 from part 1.
Noise power and a matched load
It's important to note that the noise power available to a "matched" load is independent of the source resistance. This is implied by Equation 1. It's a bit difficult to see, because if you look at Equation 5 from part 1 you'll note that changing the source resistance changes the equivalent noise voltage (or current in Equation 6, part 1). However, if you change the source resistance - lower it to reduce thermal noise voltage, for example - the matched load is changed to the same value. You can take the model of Figure 3, part 1 in terms of the general source resistanceand compute the noise power delivered to the load using Equation 5.
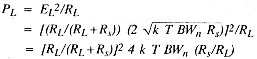
but RL = RS for a matched load. Thus:
![]()
The result in Equation 7 is the same as that given in Equation 1. This is to be expected because you worked forward from Equation 1 to arrive at Equation 5. However, taking the analysis full circle to the starting point should demonstrate that the thermal noise power available at a matched load is independent of the actual resistance, even though the actual equivalent noise voltage and current are functions of the resistance.
Maximum thermal noise power
The implication of Equation 1 is very important. Because the noise power available at a matched load is independent of the source impedance (resistance and reactance), you may compute the maximum thermal noise power available to a load (an amplifier input, for example) without any information about the amplifier or the system in which it is used. From Equation 1, that power level at room temperature is about 4 x 10-21 watts/Hz of noise bandwidth, or -174 dBm/Hz. This may seem like a very small level, but remember the value is for a "1-Hz" bandwidth. In the preceding example with a π/2-MHz noise bandwidth, the. limiting thermal noise power would be -112 dBm. The 1.12µV thermal noise voltage of the 50-ohm source resistor with a π/2-MHz noise bandwidth delivered 0.56 µV to a matched load. Consequently, the thermal noise power available at the load from the source resistance is 6.29 x 10⁻¹⁵ watts, or -112 dBm.
Source noise and amplifier noise
It may seem that the noise performance (S/N) could be improved by providing a less than optimum impedance match. It's true that in such a case less source noise would be available at the amplifier input. However, because the source resistance is the same for both the noise and signal components, less signal will also be coupled. For any given signal, the source signal-to-noise ratio remains constant for any matching condition. Because the amplifier to which this source is attached is very likely to contribute some noise, any reduction in the input signal component tends to cause the amplifier noise to be more significant and suggests a degradation in the noise performance of the system; that is, the output signal-to-noise ratio would be degraded. But for any specific amplifier and nonzero source level, there's a source impedance that will result in the best signal-to-noise ratio. This is the noise match impedance, and it's totally unrelated to the optimum power transfer impedance(1)(3) It is a function only of the amplifier noise characteristics. This concept is discussed in detail in References 1 and 3.
Noise figure
The noise figure is defined as the ratio of the total output noise power of a system to the output noise power due to the source alone, expressed in decibels. You can read Reference 3 if you'd like a detailed description.
![]()
Noise analyses are generally referred to the output of the systems under consideration. The system output is typically the most convenient point to make signal measurements. Also, in many cases, the various signal quantities of interest aren't directly accessible. For example, the equivalent input noise voltage of an amplifier can't be measured directly. It must be computed from output noise measurements.
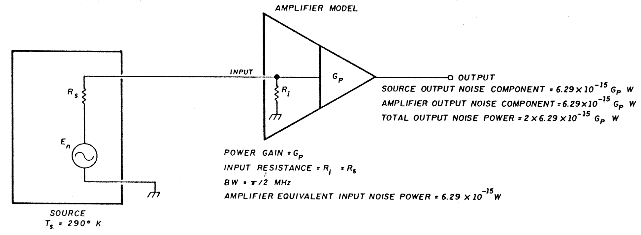
Consider the amplifier in Figure 1 with a power gain Gp, signal bandwidth of 1 MHz, equal source and inputresistances, and a room temperature source. The noise power at the amplifier input due to the source is 6.29 x 10⁻¹⁵ watts. Also, let the amplifier have an "equivalent input noise power" equal to that delivered to the input by the source resistance, 6.29 x 10⁻¹⁵ watts (unity power signal-to-noise ratio). The output noise power due to the source is 6.29 x 10⁻¹⁵ watts x Gp. The total output noise power is equal to the sum of the spurce and amplifier noise power contributions. Because the amplifier equivalent input noise was defined to be equal to the source noise, the total output noise power is twice the source noise contribution. This means the noise figure is 10 log (2), or 3 dB.
Noise figure as a function of temperature
The preceding seems like a reasonably good specification for the noise performance of an amplifier. It is perhaps the most common method of specifying the noise of various systems. However, it does have at least one serious shortcoming: a specific noise figure value is valid only at a specific temperature. For a specified noise figure value to apply, the source must be at the same temperature in the application as it was for the original specification. To demonstrate this, I'll cool the source resistor in Figure 1 to a temperature of 96.7°K. The noise figure given by Equation 8 will then be 6 dB. The cooler resistor contributes less noise. So the amplifier noise power, although the same in both cases, is a factor of 3 higher than the source contribution when the source is at 96.7°K, while it is equal in the 290°K case. The total output noise is actually reduced with the colder source. For any given signal, the signal-to-noise ratio is increased. But the percentage of total output noise contributed by the amplifier in the cold case is higher than it is for the room temperature case. This results in a poorer noise figure, even though the signal-to-noise ratio for any specific signal is improved (see Reference 3 for a more detailed discussion of NF versus S/N). In order to effectively use a noise figure specification, you must know the temperature at which the noise figure was specified. Of course, this isn't particularly useful if you wish to use the amplifier for sources of a different temperature, or perhaps if you don't precisely know the source temperature.
Equivalent noise temperature
The noise characteristics of an amplifier may be specified in an alternative manner. From Equation 1, the maximum noise power available at the input to a system is a function of only the source temperature and the noise bandwidth (and of course Boltzmann's constant). This maximum available noise power occurs only for a power-matched condition of the source and amplifier input. For any real system, a value of temperature for the matched source may be computed by rearranging Equation 1 so the noise contribution due to the source at some point in the system of interest (usually the output as discussed above) is the same as that contribution at that same point from the noisy amplifier itself.
The equivalent noise temperature of the amplifier is the temperature to which a power-matched source resistance must be set to provide a source output noise power component equal to the amplifier component of output noise power.
In the amplifier example with the room temperature (290°K) source, the source noise contribution and amplifier noise contribution are equal. Here, the source must be at 290°K to provide an output noise component equal to that of the amplifier. That amplifier is then a 290°K amplifier. If this amplifier were used with the 96.7°K source, it would still be a 290°K amplifier. It's important to remember that equivalent noise temperature is a property of the amplifier (or other system characterized) - somewhat like gain - and is independent of the application.
Ideal and real noise applications
The noise temperature specification has a shortcoming. It is a specification of noise performance when the sourceis power matched to the amplifier and may be thought of as a type of ideal specification. It usually doesn't represent the performance provided in a real application. If an unmatched source is used with an amplifier of some specified noise temperature, the output signal-to-noise ratio will be different from that obtained with ideal matching (it could be better or poorer). However, the noise temperature specified for the amplifier would still be correct because it's based on performance in a specific configuration. Further, because the noise temperature is based on an input power-matched condition, it provides no information about the optimum performance that may be obtained in a noise-matched input. A similar noise temperature versus signal-to-noise ratio comparison could be made as presented in Reference 3 for noise figure versus signal-to-noise ratio. Just because an amplifier has a very low noise temperature doesn't mean it will provide best signal-to-noise ratio in a specific application. It's very likely that a higher noise temperature amplifier with an input well noise matched3 to the source will provide a much better signal-to-noise ratio than an amplifier of much lower noise temperature with a poorly noise-matched input. The optimum noise-matched source resistance is given by the ratio of the equivalent input noise voltage and the equivalent input noise current. See References 1 and 3 for a thorough review of noise matching.
Noise-matching example
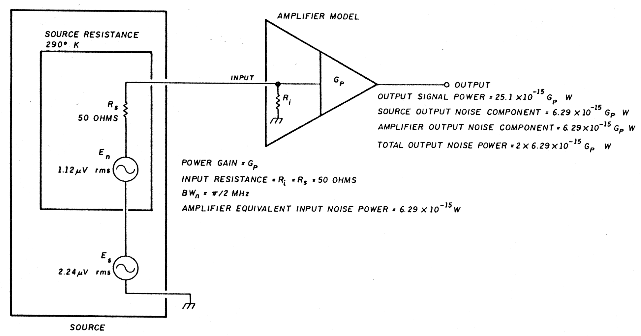
- 290°K amplifier. Consider the amplifier in Figure 2. It's the same as that of Figure 1 with a signal added. The amplifier equivalent noise temperature is 290°K, input resistance is 50 ohms, signal bandwidth is 1 MHz, and power gain is Gp. For convenience, I chose 2x1.12 µV rms as the input source signal. This is twice the source thermal noise level. The signal at the amplifier input is then 1.12 µV rms and the output signal power 25.1 x 10⁻¹⁵ Gp watts. The noise voltage available at the amplifier input from the 290°K source is 0.561 µV, an output noise power due to the source of 6.29 x 10⁻¹⁵ watts. Because the amplifier has a 290°K noise temperature, its equivalent input noise power is the same as that of the 290°K source, or 6.29 x 10⁻¹⁵ watts. As a result, the total output noise power is 12.58 x 10⁻¹⁵ Gp watts. This means the power signal-to-noise ratio is 2, or 3 dB.
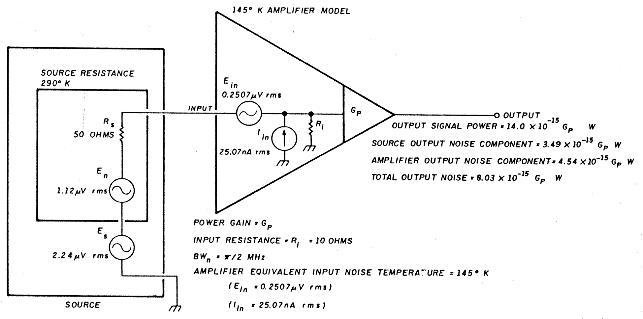
- 145°K amplifier. With this same source, I'll try another amplifier with a noise temperature of 145°K. This is a factor of 2 lower than the 290°K unit, but with a 10-ohm input resistance - a factor of 5 lower than the matched case. I chose these values for convenience of calculation; they aren't intended to represent any realistic application. However, the 145° value is a modest specification, and the 10-ohm value of input resistance isn't too unreasonable. An NE13783 low noise FET exhibits about a 10-ohm resistive input impedance at 12 GHz. These values are actually quite realistic.
This amplifier is shown in Figure 3. Because this is a mismatched case, you need additional information about the amplifier to make truly accurate computations. The noise voltage and current sources at the amplifier input are the "equivalent input noise sources"1 The values shown give an optimum noise match and 145°K noise temperature at the specified 10-ohm source resistance. There's a family of equivalent input voltage and current source values that will provide a 145°K noise temperature. In a real application of computing noise performance, the equivalent sources would be accurately measured. For this example, the values of Figure 3 are the defined amplifier characteristics. - Noise temperature verification. First I'll verify that the amplifier is a 145°K unit. The input noise power due to the two amplifier noise sources alone when attached to a matched 10-ohm noiseless (zero degree) source is 3.14 x 10⁻¹⁵ watts, and the output noise power is 3.14 x 10⁻¹⁵ Gp watts. According to Equation 1, the temperature to which a souce resistance must be raised to deliver that thermal noise power to a matched load with a a/2-MHz noise bandwidth is 145°K. The amplifier is then indeed a 145°K unit.
The noise power at the amplifier input due to the 290°K, 50-ohm source and the amplifier equivalent noise sources in Figure 3 is 8.03 x 10⁻¹⁵ watts. This yields a total output noise power of 8.03 x 10⁻¹⁵ Gp watts. The input signal voltage is 0.374 µV which produces an output signal power of 14.0 x 10⁻¹⁵ Gp watts. The power signal-to-noise ratio is then 1.74, or 2.4 dB. - Analysis. Substituting a lower noise amplifier in the system with the 50-ohm source resulted in a poorer signal-to-noise ratio. But what would happen if you had a source with a 10-ohm source resistance and the 145°K amplifier? This is the optimum "noise-matched" resistance for the amplifier in Figure 3. (It's also the optimum power match in this case, but that isn't significant.3) This impedance transformation may be very conveniently and realistically accomplished using a transformer with a 2.24:1 turns ratio. By using an ideal transformer, you maintain the source signal power constant and can easily compare various power signal-to-noise ratio results. The transformed source temperature remains 290°K. The amplifier noise temperature is still 145°K because that specification is independent of application. In this case the input signal power will be 25.1 x 10⁻¹⁵ watts and the output signal 25.1 x 10⁻¹⁵ Gp watts. The total output noise power from the 10-ohm, 290°K source and the amplifier noise sources will be 9.43 x 10⁻¹⁵ Gp watts. That results in an output power signal-to-noise ratio of 2.66:1, or 4.3 dB.
All noise parameters must be recognized
I started with a 290°K amplifier with a 50-ohm input resistance and a 290°K, 50-ohm source and obtained a 3-dB signal-to-noise ratio with a 2.24-µV source signal voltage.
I then substituted a lower noise 145°K amplifier with the same signal source and obtained a 2.4-dB signal-to-noise ratio. The lower temperature and lower noise amplifier provided a 0.6 dB poorer signal-to-noise ratio than the higher noise 290°K amplifier with the 50-ohm room temperature source. Then I transformed the 50-ohm, 290°K source to a 10-ohm optimum noise-matched value, still at 290 °K. With the same 145°K amplifier that provided the 2.4-dB signal-to-noise ratio with the 50-ohm source, I then obtained a 4.3-dB signal-to-noise ratio. So this 145°K amplifier with a fixed source power provided a 2.4-dB signal-to-noise ratio with one source resistance and a 4.3-dB value with another. But the noise temperature was constant. Can this be correct? Is there an error here?
The calculations are correct, and indeed this result can easily occur in practice. Although the higher noise temperature amplifier generally exhibits higher noise than the lower temperature unit, it provides a better noise match to the 50-ohm source than did the specified 145°K unit. This gives a better signal-to-noise ratio for any given signal. In the final example, the 10-ohm source provides an optimum noise match resulting in the best signal-to-noise obtainable with the particular amplifier being modeled. What's important here is that the lower noise temperature amplifier has the capability to provide the better noise performance. But to actually obtain improved performance, all of the noise processes must be well understood and the various noise parameters used correctly.
Importance of understanding noise parameters
In practice you rarely know the exact resistances involved. You have to ask: What is the actual source resistance of an antenna? Is it the radiation resistance? The element resistance? The connecting transmission line resistance? Or is it a combination of all of these? What is the effective temperature of the source(s)? Further, what is the actual input resistance of a low noise amplifier (LNA)? Worse yet, does the LNA even come close to providing a good noise match to your source? These are all very difficult questions toanswer. Careful measurement of the noise parameters must be completed before you can accomplish any true optimization. It's actually possible to replace one LNA with a lower noise temperature unit and achieve a poorer signal-to-noise ratio. Those of you who have experimented with various "inexpensive" LNAs may have stumbled on this paradox. Because these amplifiers are manufactured more for low cost than consistency, they tend to exhibit considerable variation in performance parameters from unit to unit. Even when substituting two identical models, you may see a considerable difference in noise. Of course, a noisier unit may also be defective, or a quieter one could be a premium low noise unit. An understanding of the actual noise processes is critical for successfully optimizing system noise performance.
Comparing noise temperature and NF
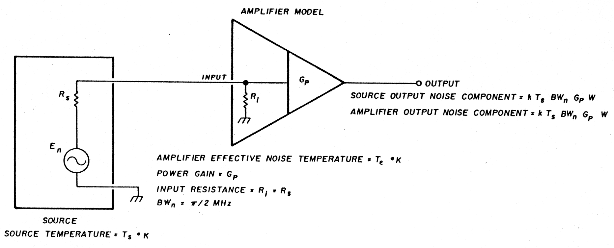
As a final thought, it might be useful to compare noise temperature and noise figure. Both of these specifications are measures of device noise, so it should be possible to compare them effectively. To do this, use Equation 8 and the amplifier model in Figure 4. This amplifier configuration is similar to those shown earlier, but has a general source temperature TS and an amplifier equivalent temperature Te. Because the configuration in Figure 4 offers a matched load to the source, you know the noise power delivered to the amplifier input from Equation 1. The output noise power due to the source alone, Ps, is then given by Equation 9.
![]()
Now when the amplifier is attached to a power-matched source at a temperature equal to the effective temperature of the amplifier, the source and amplifier contribute equal noise components to the total output noise. This is essentially the definition of effective noise temperature. The component of the amplifier output noise, Pa, is simply equal to the noise that would be output if the amplifier were noiseless and the source were at a temperature Te. By the definition of effective temperature, Te is that temperature to which you must raise the source if the amplifier were noiseless to produce an output noise equal to that of the actual noisy amplifier with a noiseless source. Once again, the input power is given by Equation 1 and the corresponding amplifier output noise power contribution by Equation 10.
![]()
By combining Equations 8, 9, and 10, you can express the noise figure in terms of the source temperature and the amplifier effective temperature.
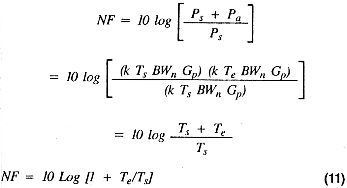
Equation 11 then lets you compute the noise figure of an amplifier from its effective noise temperature. For example, if you have a room temperature source of 290°K (Ts = 290°K), a 290°K amplifier (Te = 290°K) will exhibit a 3-dB noise figure as expected. You may also compute the effective noise temperature from the noise figure by solving Equation 11 for Te. That result is shown in Equation 12.
![]()
Closing remarks
Hopefully, all this has shown you just what the concept of effective noise temperature means and how it was derived. Unlike noise figure, the noise temperature is a device parameter (like gain) and is independent of the application of the device. On the other hand, noise figure is a comparison of the output noise power of a system due to the source alone - a real source, any source, matched or not - to the total output noise power of the system. So, the noise figure is a type of "practical" noise specification showing the performance of a real system, while the noise temperature is a type of standard specification defined under very specific conditions.
Both equivalent noise temperature and noise figure are useful parameters, but both have shortcomings. The successful use of any parameter depends upon a thorough understanding of that parameter. Obtaining optimum noise performance depends greatly on your understanding of the noise processes and careful application of the optimizing principles discussed in this article and the references.
References
- C.D. Motchenbacher, and FC. Fachen, Low-Noise Electronic Design, Wiley. New York. 1973.
- SP Parker, McGraw-Hill Dictionary of Scientific and Technical Terms, Third Edition, McGraw. Hill, New York, 1984.
- M.E. Gruchalla, "Understanding Noise Figure:. Horn Radio. April 1987. page 89
Bibliography
- Joe Carr, K4IPV, "Practically Speaking: Noise, Signals, and Amplifiers:' Ham Radio, February 1988, page 77.
Michael E. Gruchalla.