Receiver sensitivity signal and noise
If we could amplify just the wanted signal, then we would be able to read even the weakest of signals merely by adding more r.f. gain to the front-end of our receivers! Unfortunately, when we add gain, not only do we increase the background noise of the signal itself but we also tend to introduce extra noise resulting from the process of the amplification.
Let's look at the sort of signal we might wish to amplify. In Fig. 1a you can see a signal comprising a number of discrete frequency components (e.g. a modulated signal), rising from a relatively low noise floor. The signal to noise ratio (S/N) can be regarded as the amplitude difference between the noise floor and the signal peak. This 'distance' along the amplitude axis is commonly expressed as a dB ratio. In Fig. 1b you can see the same signal, but this time relative to a higher noise floor and hence with a smaller S/N.
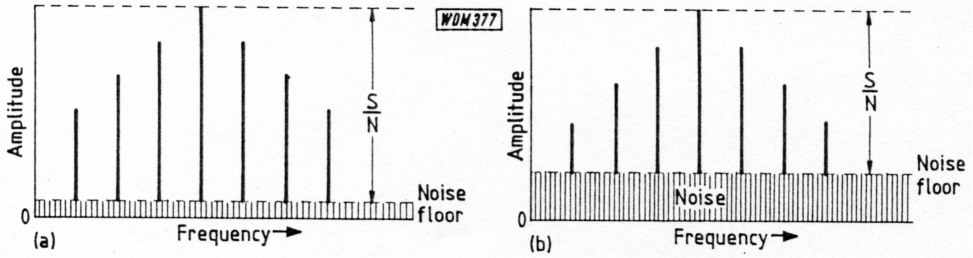
Fig. 1: A signal spectrum rising from a relatively low noise floor (a) and a similar signal rising from a higher noise floor (b), showing the signal-to-noise ratios (SAM).
In many cases the readability of a signal is determined by the S/N. Thus, while signal (a) may represent R5, the higher noise floor of the signal (b) may impair the readability to R3 or R4 at best. What, then, can we do to make a signal such as (b) more readable? There are two primary things: one, of course, is to reduce the noise floor and the other to increase the signal amplitude.
All right, we may say, let's increase the r.f. gain. by bringing in a pre-amplifier since this will increase the signal amplitude. Yes, certainly the amplitude will be lifted, but so also might the noise floor by the same amount. In that case the S/N will be unchanged - readability would not have improved despite the signal meter indicating S9 plus! We shall be seeing that there are times when a dedicated low-noise pre-amp can improve the S/N; but there are other times when the S/N might be further worsened by a pre-amp. We have undoubtedly encountered these effects when using the antenna pre-amp combined with some v.h.f. linears, where switching in the pre-amp dramatically steps up the S-reading yet does little to enhance the readability of a weak signal.
If we want to increase the signal amplitude, then one of the best bets is to improve the antenna at the operating frequency or by using a beam array directed for maximum signal response consistent with the best discrimination against QRM.
Noise Power Bandwidth
It is possible to reduce the noise floor at the expense of signal bandwidth and in this respect a couple of interesting diagrams are given in Fig. 2. At (a) a very high noise floor is shown which almost buries the wanted signal, yielding a very poor signal to noise ratio. The same signal is also present at (b), but this time it is passed through a narrow band-pass filter. Now, because the noise power falls as the bandwidth of a given signal spectrum is decreased, so the noise floor falls and the wanted signal, within the reduced operating bandwidth, rises above the noise and a very much enhanced S/N occurs, as shown.
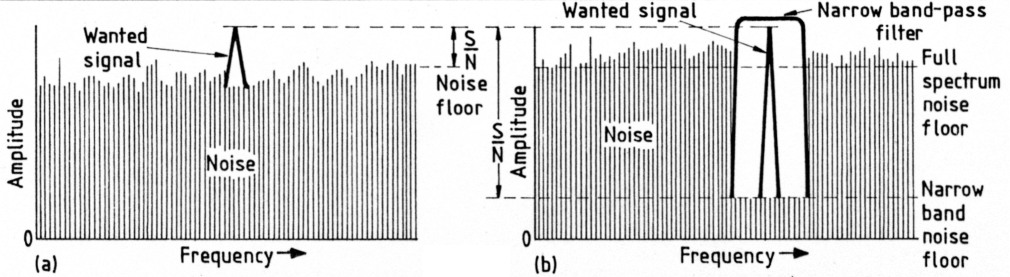
Fig. 2: A wanted signal almost buried by noise over a relatively wide spectrum (a) resulting in a very poor S/N. Part (b) shows how the S/N can be greatly improved by passing the signal through a narrow band-pass filter.Receiver sensitivity signal and noise.
From the first principles, the improvement in S/N corresponds to the ratio of the full bandwidth to the reduced bandwidth. By way of an elementary illustration, let's suppose that the full bandwidth is 5kHz and the filter bandwidth 100Hz (both to the -3dB or half-power points), then the ratio is 50:1. Hence the improvement in S/N is 50 times, or 17dB (power). This can certainly make the difference between a non-readable signal and a perfectly readable one!
Such a small bandwidth, of course, is only realisable with Morse code or data signals. Speech calls for significantly wider bandwidths; but, although the very narrow Morse-type of filtering cannot be used for s.s.b. signals, somewhat wider band-pass filters can be desirable. though the S/N improvement is less than with c.w: signals. With f.m. signals, of course, the requirement is for even wider bandwidths; but even with this mode it seems possible to reduce the channel width to something less than 25kHz, anyway. We shall possibly be hearing more about this at a later date.
What About Sensitivity?
Now having set the stage so to speak, let's see what is meant about sensitivity. The basic expression for sensitivity is merely the antenna signal level required for a stated S/N. Instead of an antenna, a modulated signal generator is correctly coupled to the receiver and the receiver tuned to the signal produced by the generator. It is usual to set the modulation somewhat below the maximum appropriate to the particular mode under test. The modulation level should be stated in the spec.
Of course, a meter is required at the output of the receiver, instead of the speaker or 'phones, to set a 0dB datum at the modulation level and volume control setting used. An audio millivoltmeter is highly suitable, and this is connected across a suitable value resistor which is replacing the speaker at the output of the receiver. To achieve the 0dB datum, the r.f. output from the signal generator is set fairly high to start with. After setting 0dB on the meter by adjusting its sensitivity and/or receiver's volume control, the modulation is switched off and the meter's sensitivity stepped up allowing the meter to read noise only down to about -10dB or so, as required.
Sensitivity at any appropriate S/N can be determined by adjusting the r.f. level and making sure that the 0dB reference is correct at each r.f. input. The diagram in Fig. 3 shows that we are not really measuring the true S/N because when the 0dB datum is set, especially at low r.f. inputs, the meter must be reading the noise as well as the signal. The ratio is thus S+N/N. It would not be valid to make a sensitivity measurement by switching off the r.f. completely because, then, the receiver's a.g.c. system might increase the r.f. and i.f. gain at zero signal level. The effects of the a.g.c. should, in any case, be considered. It is sometimes best to switch it off if possible. Ratios of S+N/N of 10dB sensitivity are often given in the specifications.
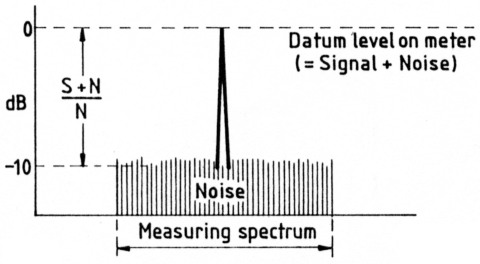
Fig. 3: When measuring sensitivity a 0dB datum is first established by the signal. The modulation is then switched off and the noise alone read as a -dB value. however, because when the datum is established the meter is reading both the signal and the noise, the ratio is really S+N/N (signal plus noise over noise). The test spectrum will also determine the amount of noise indicated (see Fig. 2)
The RF Level
The way that the signal is coupled from the signal generator to the receiver can yield a conflict between measured performance figures and specifications. It is, of course, very important always to ensure that the generator is terminated accurately to match the antenna input impedance of the receiver. In addition, the performance data should state whether the signal level corresponds to potential difference (p.d.) across the matched input or e.m.f. (electromotive force) from the generator direct. As p.d. corresponds to half e.m.f., the difference between e.m.f. (e.g. open circuit voltage from generator) and p.d. is shown in Fig. 4. Probably most reviewers of amateur radio equipment indicate sensitivity in terms of p.d., but unless the load coupling is accurately matched there will be errors. Many signal generators have their attenuators related to e.m.f., so if the generator indicates, say, 2µV (e.m.f.) for the required S/N, the sensitivity in terms of p.d. will be 1µV. The frequency spectrum over which the measurement is made will influence the results. Some engineers use 'weighting' circuits or low pass filtering so that the S/N performance relates more to the subjective (how we judge it by our ears) effect.
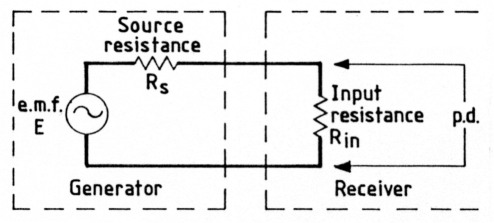
Fig. 4: Showing the difference between e.m.f. (the open circuit generator voltage, V) and the p.d. (potential difference) across the matched coupling to the receiver. When the generator source resistance exactly matches the receiver's antenna Input impedance, the p.d. is half the e.m.f. Because the antenna impedance of the receiver can affect the voltage, some engineers prefer to indicate antenna input voltage in terms of e.m.f. rather than p.d. - see text.
Signal Noise & Distortion (SINAD)
Rather than actually switching off the modulation to measure the noise content at the given r.f. input, an alternative method uses a distortion factor meter to 'notch out' the modulated audio signal at the output of the receiver, so that the meter then indicates the ratio between the signal plus noise plus distortion to the noise plus distortion (S+N+D/N+D), which is often called the SINAD ratio. Dedicated meters are available for this sort of measurement, combining the readout proper, bandpass filtering and weighting and an automatically nulling notch filter. This tunes accurately onto the modulated tone and thus puts a 'notch' at that audio frequency, so that at the output (e.g. input to the readout) there remains the noise and harmonics (e.g. distortion), which are then read on an r.m.s. basis as a dB value below the datum value originally established by the instrument. The scheme is shown in Fig. 5.
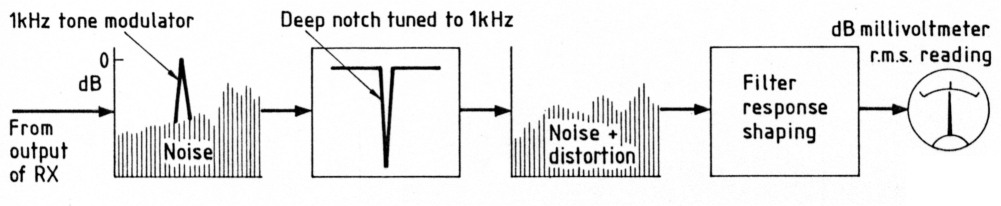
Fig. 5: Showing the signals and instrumentation for a SINAD sensitivity test. The receiver r.f. input is adjusted for a SINAD ratio of 12dB (corresponding to a distortion factor meter reading of 25%), making sure that the OdB datum is correctly set for each r.f. level change. The SINAD sensitivity is given by the signal generator, usually expressed as p V (p.d.)
It is possible, of course, to employ an ordinary audio distortion factor meter which some engineers, including me, regard as more convenient. The sensitivity is commonly referred to as a SINAD ratio of I2dB, which corresponds to a distortion factor meter reading of 25 per cent. The generator, of course, must produce modulation suitable for the mode under test, however, for s.s.b. it is feasible to apply an unmodulated carrier and adjust the receiver's tuning for a suitable (1kHz) beat note. This, then, represents the modulation which can be notched out in the usual way to achieve the SINAD ration.
A similar thing can be done for c.w. measurements. However, where the S/N of very narrow band c.w. is being attempted, account should be taken of the noise power which is being removed by the notch filter. Notch filters for SINAD tests are very narrow, but so also are some c.w. filters! To avoid noise-power error, therefore, it may be desirable to quote mere S/N (not SINAD) for c.w. sensitivity measurements. With f.m. the generator should provide a deviation some two-thirds of the full deviation of the system (for example, around ±3.3kHz for narrow band f.m. (n.b.f.m.).
The output of the receiver under test should be properly loaded (with a suitable resistor to match the speaker's impedance) and the volume control kept fairly low to avoid overload distortion. An output of about 50mW is a good level. This corresponds to 632mV across 8Ω or 447mV across 4Ω. It sometimes helps to monitor the modulation on a pair of phones or the receiver's speaker if this can be switched off when the actual measurement is made. The receiver must always be very accurately tuned to the generator signal.
Noise Signal
Noise signal is born of the random movement of electrons in electronic circuits. It is the bane of all electronic engineers - not to mention radio amateurs! Over the years many things have been done-and techniques evolved to try to minimise its effect; but it is still with us! From our 'phones or speakers it manifests as a hiss like the sound of car tyres on a wet road. When made up of components-overing a wide frequency spectrum it is called white noise, by analogy with white light which contains all the colours of the rainbow. Owing to the Niters and response characteristics of our receivers the noise we hear is more 'pink' than white. It is weighted noise. Even so, over the air we often hear it referred to as 'white noise'.
Noise Power
Power in the noise signal is equal to the product kTB where k is Boltzmann's constant (1.38 x 10⁻²³ Joules/K), T is temperature kelvin (K) and B is bandwidth in hertz, K is referred to absolute zero (-273.16 degrees C), so at an ambient of 17°C, T calculates to a shade over 290K, which is the noise temperature 'standard'.
As an example, the noise power in a resistor at 17°C works out close to 4 x 10-21W per unit bandwidth (e.g. per Hz). Thus at 10Hz bandwidth it would be 4 x 10-20W, at 20Hz 8 x 10-20W, at 40Hz 1.6 x 10⁻¹⁹W and so forth. In other words, the noise power increases by 3dB (it doubles) each time the bandwidth is doubled and decreases by 3dB (it halves) each time the bandwidth is halved. This, of course, directly relates to the noise power bandwidth discussed earlier.
Equivalent Noise Voltage
It is interesting to consider what sort of noise voltage noise power produces across a given resistor value over a stated bandwidth. Let's suppose that the noise power is acting in, say, a 500 load resistor over a bandwidth of 2000Hz (2kHz) at an ambient temperature of 17°C. Then, to work out the equivalent noise voltage we can use the simple expression of voltage equals the square-root of the product of the power is watts and the resistance in ohms.
We thus derive (kTBR)0.5, where kTB is the noise power part and R the resistance. It should be noted that the noise power is that occurring in a matched load of the same value as R and is independent of the value of R. Substituting the figures, the noise voltage across the matched load resolves to 2 x 10⁻⁸ or 0.02µV. With R at lkΩ and B at 5kHz, the noise voltage is around 0.14µV. The open-circuit e.m.f., of course, is double these values, given by (4kTBR)0.5, which is regarded as an r.m.s. voltage in series with the conductor resistance R. The noise voltage, of course, is amplified along with the antenna signal, and the effective S/N is further impaired by the noise contribution of the r.f. amplifier itself.
Noise Factor & Noise Figure
Noise factor is the input S/N to the output S/N, both direct ratios, while noise figure is the dB difference between the two when themselves expressed as dB ratios. For example, a 5:1 noise factor is 7dB noise figure (e.g. 10log5 = 7).
If an amplifier produced zero noise (not possible!) the noise at the output would be the direct contribution of the input noise (e.g. from the antenna and load). In practice the output noise is bound to be greater. The noise figure is a measure of the 'noisiness' of the amplifier.
As an example, an output S/N of, say, 2dB resulting from an input S/N of 9dB would indicate a noise figure of 7dB, this stemming essentially from the nature of the transistor and r.f. amplifier design.
Clearly, then, for the most effective operational S/N we need a receiver with a low noise figure, along with a reasonably strong antenna signal. However, at h.f., especially on the I.f. bands, a low noise figure is of very minimal consequence owing to the noises arriving from the antenna system itself! These tend virtually completely to mask the receiver noise. Just consider, for instance, the 3.5MHz band after dark and not only QRM, QRN, atmospheric noises in general, but also the multiplicity of intermodulation products stemming from many strong signals, which not only produce a dramatic rise in overall noise level but also diminish the effective dynamic range! The noise level on this band can be greater than 40dB (10 000 times) more powerful than the noise generated by the receiver.
Noise Above 28MHz
The noise figure plays a more important role at frequencies above about 28MHz, where the antenna noise is essentially cosmic and hence more sanitary. At v.h.f. and above, therefore, we should strive for receivers with the lowest possible noise figures. Modern 144 and 430MHz band rigs are, in fact, designed with a low noise figure in mind. This is aided by the use of low-noise r.f. amplifier transistors, and the design focusing on low noise performance rather than maximum possible gain.
It is not particularly easy to improve on the noise figure achieved by the manufacturer of a v.h.f. or u.h.f. rig without, perhaps, a minor redesign of the r.f. amplifier stage, for it is the first stage of a rig which is generally more important from the aspect of S/N ratio improvement than subsequent stages. Sometimes a change of r.f. transistor can help and/or careful realignment of the front-end for the lowest noise figure (e.g. best S/N). After purchasing some years ago a Yaesu FT-480R 144MHz rig, I was able to attain a very worthwhile improvement in noise figure merely by 'optimising' the drain current of the 3SK59Y r.f. transistor and realigning!
If one has a 'deaf' 144MHz band rig, there's always the temptation to hook in an external antenna pre-amplifier. Working 144MHz band s.s.b. on a not-very-strong signal without the pre-amp, one can be fooled into concluding that the pre-amp is a worthwhile device by the way the S-meter reading shoots up when it is switched in! Any pre-amp will give higher S-meter readings and make s.s.b. signals louder; but is the S/N improved? Try tuning an R3/ R4 s.s.b. signal without the pre-amp, and then switch in the pre-amp. After resetting the volume control to get the audio level the same as before, determine whether the signal is now R4/R5. If it isn't, then there's not much point in having the pre-amp in circuit. In fact, it could be doing more harm than good merely by amplifying all the signals - weak and strong ones - and hence dramatically reducing the overload margin of the receiver, and possibly inciting spurious responses and intermodulation products in the r.f. amplifier and mixer stages! In other words, the dynamic range of the receiver could be impaired by as much as the gain of the pre-amp. The craft, then, is not particularly for high gain, but for the best noise figure!
Improving the Overall Noise Figure
Nevertheless, a well designed pre-amp, such as those produced by the small, specialised British firms can certainly enhance the S/N performance of a v.h.f. front-end if the rig itself isn't endowed with a particularly exciting noise figure. As already mentioned, it is the first r.f. amplifier which is the critical one from the noise performance aspect. Total noise of a system takes account of the input circuits, r.f. amplifier, mixer,etc., according to the expression:
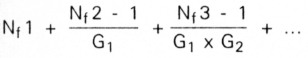
where Nf1, Nf2, Nf3, etc., are the noise factors of the first, second, third, etc., stages and G1, G2, etc are the direct ratio power gains of the first, second, etc., stages. Let's suppose that our 144MHz band rig has a noise figure of 4dB (2.5 noise factor) and we hook in a pre-amp with 2dB noise figure (1.58 noise factor) and 14dB gain (25:1 power ratio), then by using the first part of the foregoing expression we obtain:
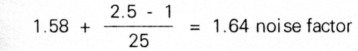 or 2.15dB noise figure.
Thus, by using this low noise pre-amp we have achieved a 1.85dB improvement in noise figure over the rig without a pre-amp. Quite a worthwhile improvement which would undoubtedly be noticeable on a weak s.s.b. signal, possible making an R3/R4 signal into an R5 one!
We can do even better than this by putting the pre-amp at the top end of the feeder, near the antenna. If, for example, the feeder at 144MHz has a loss of 3dB, the signal at the input of the pre-amp will be twice the power, thereby improving the S/N by 3dB. However, the total noise figure will worsen since in effect 3dB will be knocked off the pre-amp gain, leading to a total noise figure of 2.3dB, which is still very good.
If the feeder is fairly long and hence lossy, it certainly pays to site the pre-amp close to the antenna; but with an ordinary antenna system the pre-amp at the rig end of the feeder will do a good job if its noise figure is less than that of the rig. A relay, r.f. or 'hard-switched' operated, by-passes the pre-amp in the transmit mode.
In summary then, the noise factor of an ideal receiver can be defined as the number of times by which the signal power from the antenna must exceed kTB to provide unity S/N! In terms of practical performance, a receiver with 10dB S+N/N with an input of lµV to 3µV is very good. At v.h.f. and above, higher sensitivities are being achieved; but at h.f. the 'usable sensitivity' is invariably established by atmospherics and other noises below 12MHz, as already noted.
Because of the reduced noise-power bandwidth required for reading Morse code, receiver sensitivity is commonly higher in this mode. In fact, with a narrow-band c.w. filter a S/N advantage up to 20dB becomes possible in with with respect to s.s.b. This means that a signal just bordering on R5 c.w. would need to be raised by more that three S-points to provide similar readability on s.s.b. Or, put another way, a c.w. transmitter with 100 times less power would provide a similar readability. Hence the popularity of c.w. QRP.
Dynamic Range
The noise floor is also caused to rise by spurii and intermodulation effects generated in-band by the large-signal limitations of all receivers. Viewed from the large-signal side of the dynamic range sandwich, the 'usable dynamic range' can be regarded as that dB range over which the multiplicity of signals can increase such that the intermodulation products (essentially third and odd-order) do not result in a significant rise in noise floor. In other words, a receiver with a good dynamic range performance is not only adequately sensitive for the band in use, but also one whose spurii and intermodualation products are well tamed.
We have seen, therefore, that receiver sensitivity is certainly not the 'be all and end all' of receiver performance. A more important consideration, in fact, can be how well a receiver can handle strong signals.