External noise vs receiver sensitivity
All listeners to the h.f. bands know that external noise can sometimes cause even strong signals to become unreadable. For this reason, many textbooks on h.f. receivers contain a sentence to the effect that, the sensitivity of h.f. receivers need not be very good.
In spite of what the textbooks say, the signal to noise ratio sensitivity of modern receivers is becoming better and better. You only need to look at advertisements and reviews. Many amateurs must have asked themselves the question: When really is the sensitivity good enough and at what value is there no point in improving it anymore?
I found a few articles on this subject but none really gave me the answer, until I read the article by Gerald Stancey G3MCK(1).
This article addresses the point directly and is actually a very good one. My article is an extension and expansion of Gerald's thoughts and an attempt to arrive at some sort of answer.
No Theory
I'm not going through all the theory of noise, sensitivity, noise figure, noise factor, etc. This is given in all textbooks and well condensed in Gerald's article. I shall only give a few of his final formula here.
If the `noisiness' Ny, of a receiver is defined as: the signal to noise ratio at the input (Si/Ni) divided by the signal to noise ratio at the output (So/No) of a receiver, it can be shown that
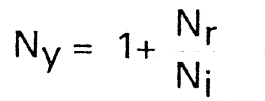
where:
Ny = noisiness of the receiver
Ni = noise at input of receiver (external noise)
Nr = noise added by receiver
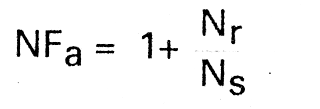
If the lowest possible external noise is only the thermal noise at room temperature in a certain bandwidth, we can take this as standard (Ns). Then Ni = Ns. At this condition, the noisiness, Ny = NFa (the well-known noise factor) or noise figure NFi if expressed in dB. The relationship between the two is: NFi = 10log(NFa).
Thus we can see that
Now, say the noise input Ni is a factor Ne more than the standard Ns, then Ni = NeNs or Ni = Ne + Ns (when expressed in dB) Then
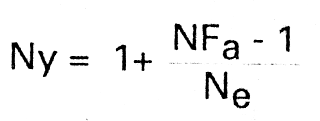
We now have thenoisiness, Ny, in terms of the noise Factor, NFa, and the external noise, Ne, above the noise standard, Ns.
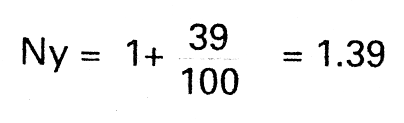
An Example
Let's have an example. Say a receiver has a NFi = 16(dB), then NFa = 40. If on 21MHz the external noise is 20dB above the standard, eg. Ne = 100, then
Calculations & Results
From the above theory we can now draw up a few tables and graphs to put the whole thing into perspective. In Table 1 the external h.f. spectrum. noise data is summarised. This data can be found in virtually every radio handbook.
The data in Table 1 is taken from the Radio Communications Handbook. In column 1 of the table are the different frequency bands. Column 2 is the different times of day conditions. Column 3 is the external noise Ni reaching the antenna in dBm (referred to one milliwatt).
Column 4 is the same data expressed in microvolts to give you a better feeling for the values. In modern transceivers S9 on the S-meter can represent anything between 20 to 50µV an the antenna.
Column 5 in the table is the external noise Ne (in dB) above the s tandard (-141dBm in this article, which is the thermal noise at room temperature in a 2100Hz bandwidth).
A rough plot of Ne against frequency is shown in Fig. 1. You can see the noise levels on the 1.8, 3.5 and 7MHz bands in stormy conditions really are quite high - as you all well know.
Now we come to Table 2 where column one contains different values of Ne. Column two has four different values of receiver sensitivity noise figure (NFi) in every Ne group. Column three has the same values in V.
Columns 4 and 5 are calculated values of Si/Ni for m.d.s. (So = No), using the relevant values of Ne and NFi (converted to NFa). In columns 1, 2 and 6 are the value of So/No (in dB) to give an input value of Si/Ni = 10dB for the different Ne and NFi values.
If the above Sounds complicated, it will be clearer after looking at Fig. 2, a plot of the figures in Table 2. The plot is column one against column six for the different values in column two. Putting the explanation in full: Fig. 2 is a plot of the external noise Ne against So/No (if Si/Ni = 10) for different values of receiver sensitivity NFi.
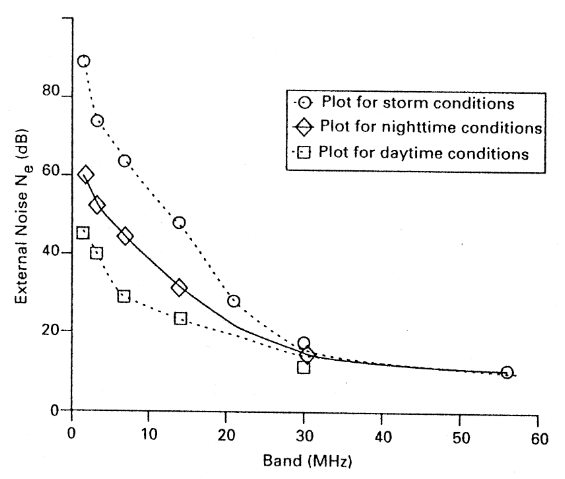
Fig. 1: This graph plots the external noise above a standard level for over the various bands.
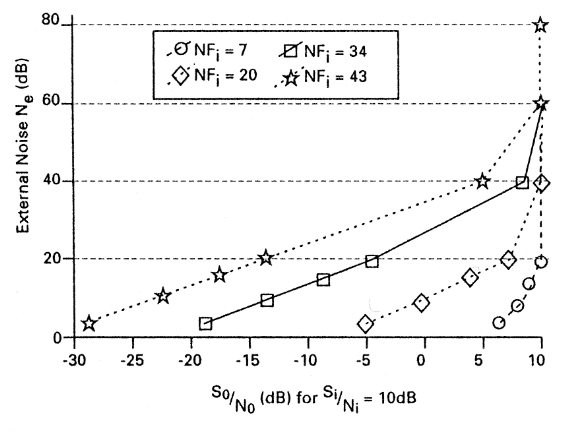
Fig. 2: This graph shows the external noise above a standard against So/No (when Si/Ni=10) for differing values of receiver sensitivity (NFi).
| Band | Condition | noise | noise above | |
|---|---|---|---|---|
| MHz | dBm | µV | standard | |
| 1.8 | Storm | -51 | 630 | 90 |
| Night | -81 | 20 | 60 | |
| Day | -96 | 3.5 | 45 | |
| 3.5 | Storm | -66 | 112 | 75 |
| Night | -88 | 8.9 | 53 | |
| Day | -101 | 2 | 40 | |
| 7 | Storm | -76 | 35 | 65 |
| Night | -96 | 3.5 | 45 | |
| Day | -111 | 0.63 | 30 | |
| 14 | Storm | -96 | 3.5 | 45 |
| Night | -108 | 0.89 | 33 | |
| Day | -116 | 0.35 | 25 | |
| 21 | Storm | -111 | 0.63 | 30 |
| Night | -116 | 0.35 | 25 | |
| day | -121 | 0.2 | 20 | |
| 28 | Storm | -126 | 0.11 | 15 |
| Night | -126 | 0.11 | 15 | |
| Day | -126 | 0.11 | 15 | |
| 56 | Storm | -131 | 0.063 | 10 |
| Night | -131 | 0.063 | 10 | |
| Day | -131 | 0.063 | 10 | |
Another example
As an example: Say on 7MHz during daytime the figure for Ne = 30 (from Fig. 1) and you have a receiver with a poor NFi = 34dB (lµV). You can see from Fig. 2 that you will get So/No = 4.4dB for an input of Si/Ni = 10dB. It is from Fig. 2 that we will try to answer the question posed at the start of the article.
Some conclusions
To arrive at some conclusion we must move from radio science to human physiology, which differ from individual to individual. In physiology textbooks one reads that the smallest difference in sound (at say 1000Hz) that the human ear can detect is 1dB(3).
The figures quoted seemed very low in value So, in the interests of science, I did a few rough experiments with two of my children. Using an amplified audio signal generator, and an a.c. digital voltmeter I let them hear pure tones through headphones. Sure enough, all the values were between 1 and 2dB except at very low sound levels where it rose to 3 or 4dB.
Returning to Fig. 2, if the perfect receiver gives So/No = 10dB for Si/Ni = 10dB and, if one can detect a 1dB difference, then you should be able to detect a difference at So/No = 9dB and lower.
So, if we draw a vertical line at So/No = 9dB in Figure 2, then at all conditions left of this line we will be able to detect a deterioration in readability. Let's take a few examples.
- During daytime on 3.5MHz, the Ne = 40dB (from Fig. 1). Entering Ne = 40 in Fig. 2 we see that it cuts the vertical line where So/No = 9dB at NFi = 34dB (1µV). So, any better sensitivity won't help you at 3.5MHz.
- At 28MHz it can be seen from Fig. 1 that Ne is about 15dB. Entering Ne = 15dB in Fig. 2, we see that it cuts the So/No = 9dB line at a point between NFi = 20 and NFi = 7. But I estimate the value, to be probably at NFi = 9dB. So, on 28MHz it is worthwhile to have a receiver or pre-amp with this lower noise figure.
- Let's take everybody's favourite band (well it's mine anyway) 14MHz. During day time Ne = 25dB, giving an NFi of approximately 18dB. During night time Ne = 33, which gives an NFi of approximately 24dB. During stormy conditions, Ne = 45 giving a NFi of approximately 39dB. All of the above interpolated at the So/No = 9dB line.
- If you build small receivers at home, then design it for the NFi values in Table 3 for good readability, taken from daytime Ne values.
There is another question that can be asked. If you don't really need So/No = 10 or 9dB to read a signal, what is the lowest value of So/No that is still readable. There are experienced c.w. operators can read a signal below the noise level. On s.s.b. mode if someone at the other end of the link is reading numbers slowly it can also be read just below the noise level(4).
Say, for arguments sake, the lowest that can be read is So/No = 0dB, that is the m.d.s. level. Now we can determine the approximate least sensitivity which is needed on the different bands if Si/Ni = 10dB. From Fig. 1, again get the daytime Ne values for the different bands, enter this at the left hand side of Fig. 2 and read the approximate values of NFi at the So/No = 0dB vertical line. We get the following:
| 1.8MHz | NFi = 60dB |
| 3.5MHz | NFi = 50dB |
| 7MHz | NFi = 38dB |
| 14MHz | NFi = 34dB |
| 21MHz | NFi = 28dB |
| 28MHz | NFi = 23dB |
| 56MHz | NFi = 21dB |
The above values of NFi are for So/No = 0dB if Si/Ni = 10dB
We can Now determine NFi for many So/No values, or we can take a certain NFi value from Table 2 and determine what Si/Ni must be for So/No = 0 on every band. An interesting So/No case is where Si/Ni =1dB (Si/Ni = ratio 1.26). At this point So/No is 1dB less than Si/Ni. If we follow the arguments through we see that in this case the NFi values are the same as that given in Table 3. So, it seems as if the NFi values in Table 3 is the lowest that we must aim for on the different bands.
I must emphasise that my conclusions will differ from person to person. The human ear/brain is a remarkable instrument with surprising filtering properties. So much So, that it's nearly impossible to describe in exact terms.
| External noise above standard Ne = Ni - Ns |
Receiver sensitivity | Si/Ni for m.d.s. | So/No for Si/Ni = 10dB |
||
|---|---|---|---|---|---|
| NFi | µV | Ratio (Ny) | dB | ||
| 80dB | 7 | 0.046 | 1 | 0 | 10 |
| 20 | 0.2 | 1 | 0 | 10 | |
| 34 | 1.0 | 1 | 0 | 10 | |
| 43 | 3.0 | 1.0002 | 0.0009 | 9.9991 | |
| 60dB | 7 | 0.046 | 1 | 0 | 10 |
| 20 | 0.20 | 1.0001 | 0.0004 | 9.9996 | |
| 34 | 1.0 | 1.0025 | 0.0018 | 9.9892 | |
| 43 | 3.0 | 1.0200 | 0.0860 | 9.9140 | |
| 40dB | 7 | 0.046 | 1.0004 | 0.0017 | 9.9983 |
| 20 | 0.20 | 1.0099 | 0.0428 | 9.9572 | |
| 34 | 1.0 | 1.2511 | 0.9729 | 9.0271 | |
| 43 | 3.0 | 2.9952 | 4.7643 | 5.2357 | |
| 20dB | 7 | 0.046 | 1.0400 | 0.1703 | 9.8297 |
| 20 | 0.20 | 1.9900 | 2.9885 | 7.0115 | |
| 34 | 1.0 | 26.11 | 14.168 | -4.168 | |
| 43 | 3.0 | 200.5 | 23.021 | -13.021 | |
| 15dB | 7 | 0.046 | 1.1266 | 0.5177 | 9.4823 |
| 20 | 0.20 | 4.1329 | 6.1625 | 3.8375 | |
| 34 | 1.0 | 80.46 | 19.056 | -9.056 | |
| 43 | 3.0 | 832.4 | 28.010 | -18.010 | |
| 10dB | 7 | 0.046 | 1.4000 | 1.4612 | 8.5388 |
| 20 | 0.20 | 10.90 | 10.374 | 0.3740 | |
| 34 | 1.0 | 252.1 | 24.016 | -14.016 | |
| 43 | 3.0 | 1996 | 33.002 | -23.002 | |
| 5dB | 7 | 0.046 | 2.2658 | 3.5522 | 6.4478 |
| 20 | 0.20 | 32.33 | 15.096 | -5.096 | |
| 34 | 1.0 | 795.6 | 29.007 | -19.007 | |
| 43 | 3.0 | 6315 | 38.004 | -28.004 | |
| Band (MHz) | Ne (dB) | NFi (dB) |
|---|---|---|
| 1.8 | 45 | 40 |
| 3.7 | 40 | 34 |
| 7 | 30 | 22 |
| 14 | 25 | 18 |
| 21 | 20 | 13 |
| 28 | 15 | 9 |
| 56 | 10 | 6 |
References
- Stancey Gerald G3MCK, 'noise in h.f. receivers', Practical Wireless, August 1984.
- Radio Society of Great Britain, Radio Communication Handbook, Volumes 1 & 2.
- Katz J., Handbook of Clinical Audiology, 1985
- Ainsworth W., 'Recognising speech in noise'. Electronics Today International, April 1989.
ZS6UP