More on atmospheric ozone and low-frequency propagation
Quartz Crystal Parameter Measurement
Surplus crystals are abundant, but we must know more than theirftequency to use them. Here's a good way to measure their important characteristics.
Designing and making your own crystal filters makes sound economic sense only if you need a filter of a frequency or performance specification that is not commercially available, or if you have a source of very cheap crystals and usually the latter reason prevails. Because of the availability of crystals for TV and computer applications, as well as surplus crystals from commercial radiotelephones, there is a wide range of frequencies available; unfortunately, they don't come labeled with their electrical properties. These must be measured before we can determine their suitability for our designs. The graphical evaluation method described here is an aid to discovering these qualities when using simple test equipment.
Crystal Parameters
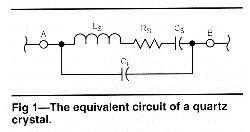
Fig 1 shows the well-known electrical-equivalent circuit of a quartz crystal. It comprises a series-resonant LCR combination shunted by the capacitance of the crystal's electrodes, plus circuit strays. This shunt capacitance creates a parallel resonance in addition to the series resonance, and this extra response complicates measurement of the value of the series components. It also plays an important part in determining the frequency response of the final filter. Its influence can be eliminated by resonating it at the series-resonant frequency by means of a shunt inductance. This is the traditional method usually described in textbooks; it can also be used to design filters with a symmetrical frequency response.(1) The alternate technique I shall describe neatly avoids the necessity for this procedure and allows both series and shunt components to be evaluated.
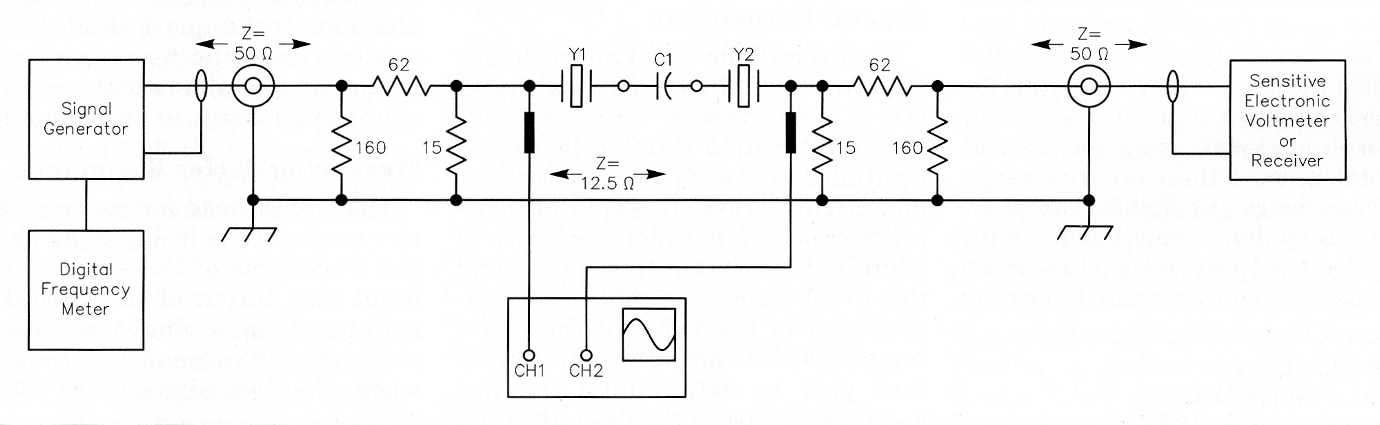
Figure 2 - The circuit used gor measuring series resonance
Measuring Series Resonance
The circuit used for measuring series resonance is in Fig 2. As shown, the waveforms of the signals at the input and output of the crystal are monitored on a dual-trace oscilloscope. Series resonance is indicated when the two signals are exactly in-phase. This is a very sensitive indication of series resonance, and the effects of very small frequency changes (a few hertz) can be readily detected.
Firstly, the series resonance of the crystal alone is measured. Let this frequency be fs. Then the measurement is repeated with C1 in series with the crystal. Call this frequencyfl. The difference between these two frequencies is related to the product of the crystal's equivalent series capacitance, Cs, and its series-resonant frequency, f, by:
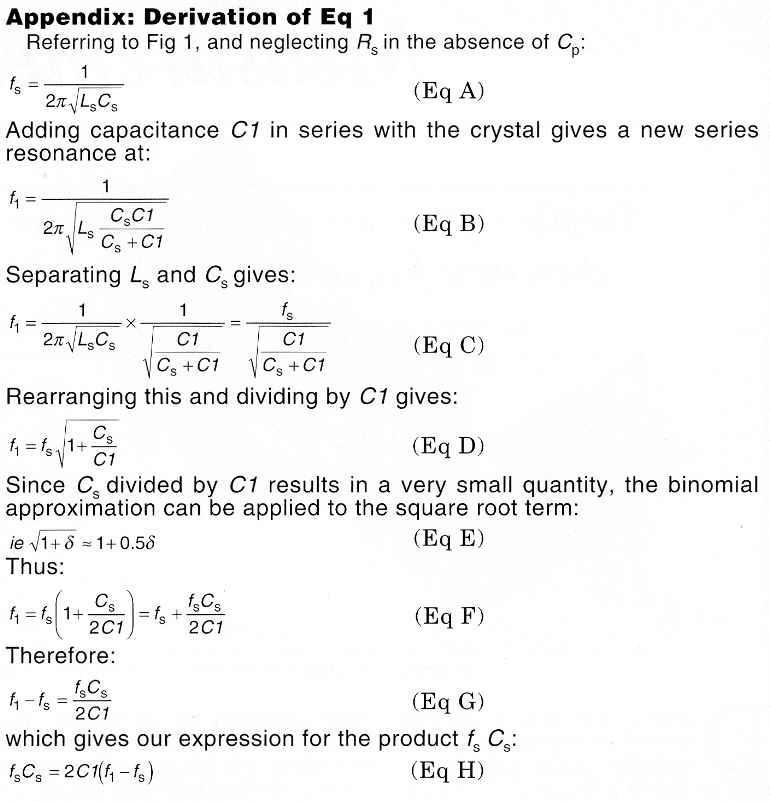
Cs is sometimes referred to as the motional capacitance of the crystal. Plotted on a log-log graph, where the horizontal axis is the added capacitance C1 and the vertical axis is the frequency shift Δf, this product results in a family of straight diagonal lines, as shown in Fig 3.
If the shift in frequency fl - f,; were plotted on the graph for each value of C1, a curve similar to the three examples shown would result. The points should be plotted as they are measured, because any that do not conform to this general shape can be rechecked immediately. This ability to detect rogue measurements is the first of the benefits of using this graphical procedure. Values of Cl between 500 pF and 5 pF were used in these measurements. While the first three readings follow the diagonal lines very closely, subsequent readings deviate farther right because of the influence of Cp. Ignore these latter readings for the time being and project the diagonal, linking the first three readings to the right-hand edge of the graph. This allows the value of the product fs Cs to be determined and hence, following division by fs, the value Cs. The effect of Cp has been neatly avoided. It was noted above that Cp causes the graph to deviate farther to the right. Cp may therefore be measured directly from the graph, since it is the displacement between the curve and the diagonal. Several points may be checked and they will be found to give very similar readings. For the colorburst TV crystals, its average value was found to be 10 pF.
Notice that several crystals were checked on a LF capacitance bridge and their shunt capacitance, on average, was found to be 7 pF, so the measurement test jig must have contributed 3 pF of stray capacitance. Now modify Eq 1 to include the shunt capacitance. Convincingly consistent values of C. can be calculated over a wide range of series test capacitors C1 using Eq 2:
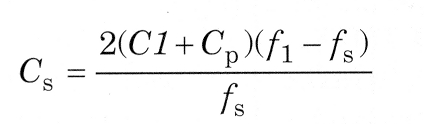
An example of this calculation is given in Table 1 for measurements on a UK color-burst (TV) crystal. A remarkably consistent series of values are calculated for Cs, even at very small values of C1. Reading f, C, from the graph gives a value of 0.155x10⁻⁶ and when this is divided by f, (4,430,849 Hz), a value of 0.035 pF is given for Cs. This corresponds very satisfactorily to the calculated values in Table 1 and shows that sufficient accuracy for most amateur designs can be achieved using the graph alone. The series capacitors used in these measurements are all silveredmica types that had been checked on a capacitance bridge.
Parallel Resonance
Applying the graphical method for a third time, a crystal's parallel resonance can be determined. Using the value of Cp as measured above, we project upwards from the horizontal axis to the diagonal line. Using the value of 10 pF, previously obtained, gives us an intersection with the diagonal at a frequency displacement of 7800 Hz. This represents the frequency difference between the series and parallel resonances, so finding the parallel-resonant frequency becomes a matter of simple addition:
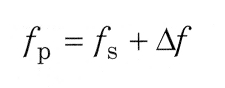
Since fs = 4430.849 kHz and Δf 7800 Hz, fp = 4438.649 kHz.
Because the parallel resonance is so dependent on circuit strays, this reading (which includes the effect of such strays) is usually found more representative of conditions in a ladder crystal filter than is found by calculation. If you wish to try the calculation, Eq 4 gives the relationship between these quantities; it can be used to check the graphical method.
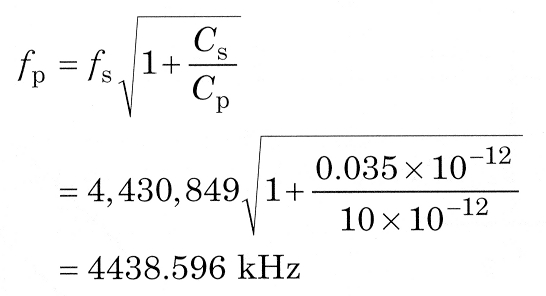
So fp = 4438.596 kHz, which differs by only 53 Hz from the value obtained graphically. That is a convincing demonstration of the suitability of the method.
Equivalent Series Resistance
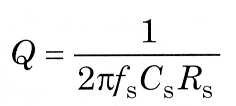
While set up for testing series resonance, the equivalent series resistance, or ESR, should be checked. To do this, insert the crystal into the test set without any series capacitance. Adjust the frequency for maximum output on the millivoltmeter. Record this value. Now remove the crystal and substitute a miniature variable resistor. This is then adjusted until the level measured on the meter is the same as noted previously with the crystal inserted. Remove the resistor and measure it on an ohmmeter. This value is the ESR and is used in Eq 5 to derive the Q of the crystal:
It should be mentioned that this method of measuring ESR is open to error if harmonics are present in the test signal. If there is any doubt about the purity of the signal-generator output waveform, it should be followed by a low-pass filter. This is because the millivoltmeter can respond to these harmonics when the crystal is not in circuit , if the meter's response extends to a sufficiently high frequency for them to be within its range. Many older instruments do not respond to the harmonics, so this warning will not apply; but if the meter does respond, it will read higher than it would when given a pure signal. In consequence, the variable resistor must be set slightly higher also, so a pessimistic reading of ESR will result. When the crystal is in circuit, it allows only the fundamental to pass. Although crystals have responses at overtone frequencies, these responses do not coincide with the harmonics so the harmonics cannot pass. I stress that this is only a warning of what could happen to the unwary; it does not imply any special difficulty in using this method of measuring ESR.
Finally, it is worth buying more crystals than you need for a filter so that you can select those with the highest Q. Any with a Q significantly lower than average should be discarded.
Conclusion
Although this article has been written from the point of view of its application to ladder crystal filter design,2 the crystal data are equally applicable to crystal-oscillator design. This interrelation has been exploited by Dave Gordon-Smith G3UUR(2). He measures Cs by placing the crystal in a Colpitts oscillator circuit and measuring the frequency shift when series capacitance is added. If you decide to use his test method, please note that he uses Cs and Cp to denote totally different quantities from the usage in this article. Apart from that, you can take the measured oscillator shift and apply the graphical evaluation method to it, for the measurement of equivalent series capacitance, Cs. It is yet to be proved that the same applies to the shunt capacitance, Cp.
Finally, I would like to acknowledge the contributions made by Lorin Knight, G2DXK, in our discussions during our endeavors to separate the various aberrations present in the graphical method. His input is greatly valued.
I would also like to record the valuable service that QST performed during my early years in Amateur Radio. Authors such as Byron Goodman, W1DX, George Grammer, W1DF, Don Norgaard and a great many more who were pushing forward amateur techniques were always read with great interest.
Notes
- W. Hayward, W7ZOI, "Refinements in Crystal Ladder Filter Design", QEX, June 1995, pp 16-21. This article was reprinted in QRP Power (Newington, Connecticut: ARRL, 1996; Order No 210).
- J. Hardcastle, GUR, "Computer-Aided Ladder Crystal Filter Design", Radio Communication, May 1983, pp 414-420.
G3JIR