Predicting amateur "conditions"
A new method of using CRPL charts for DX work.
Methods previously outlined for using CRPI. m.u.f. charts have been principally useful for determining the best working frequency between any two points at any given time of day. Here is a way to find at a glance where you can work, from a given location, at any hour. A small amount of preliminary work sets you up for rapid determination of probable DX conditions months in advance.
Publication since the war of articles in QST(1),(2),(3) and elsewhere(4) describing propagation prediction methods has no doubt caused many an amateur, particularly the DX ham, to attempt to predict the best hours for DX QSOs. Such attempts have probably not yielded results commensurate with the efforts expended, in view of the fact that the prediction methods heretofore recommended are based on the location of the desired remote station and the time of the day that it is desired to work that station. Additionally, the answer obtained by such methods is in terms of maximum usable frequency or optimum working frequency at a given hour of the day. To the average ham, the term "conditions" means "What is the best time of the day to make DX contacts?" or "What DX can I expect to work with my rig during the hours I can spend in the radio shack?"
The monthly publications giving basic radio-propagation predictions three months in advance, and originating with the Central Radio Propagation Laboratory of the National Bureau of Standards,(3) can be used to permit an amateur to predict "conditions" with fair accuracy in a usable form and with little effort after the initial spadework is done. In the present period of the sunspot cycle these predictions will be found most useful for 10-meter operation, although the techniques here described should be equally applicable to band 20-meter operation in the future.
While the prediction methods outlined in this article differ from those heretofore recommended the theory underlying each method is identical Briefly, this theory is that for distances in excess of 2500 miles (4000 kilometers), propagation is controlled by the F2 layer of the ionosphere at two control points along the great-circle path between the two stations, each point being 1250 miles (2000 kilometers) from each station toward the other station.
For prediction of maximum usable frequency by the method recommended by CRPL, the F24000 charts contained in the monthly CRPL publication are used with a world chart (also contained in the same publication) upon which the control points have been plotted. The condition of the ionosphere for each hour of the day at each control point is obtained in terms of maximum usable frequencies, the lowest of which is the maximum usable frequency for communication between the selected two stations at the designated hour, based upon reflections from the F2 layer at the two control points.
To predict amateur "conditions," as outlined in this article, the same charts are used but in a somewhat different manner. A transparent chart, upon which has been traced curves or "contour" lines representing amateur frequencies, is used with a world chart upon which there appear a control area surrounding the amateur's location and great-circle paths to all parts of the world from the control area. By moving the transparent chart horizontally, the hours of the day at which the periphery of the control area and the contour area coincide can be determined and the areas of the world that can be worked at these hours can be ascertained at 'a glance. "Conditions" on 10 meters, for example, can be determined by observing what land areas are covered by the 30-megacycle shadow of the F24000 "cloud" as it drifts from east to west during the twenty-four-hour day. The contour of this "cloud" differs from month to month and differs slightly over three zones of the world but a single transparent chart can be used to obtain a fairly accurate picture for any one month.
An amateur interested in predicting "conditions" should subscribe to Basic Radio Propagation Predictions, CRPL-D, published monthly by the Government Printing Office, Washington, D. C. (Single copies 15 cents; $1.50 per year.(5)) Figs. 1, 2, 6, 8 and 10 of this publication are used to construct the basic world chart and the transparent chart in the manner outlined below. These figures correspond with those shown as Figs. 5, 6, 7 and 9 of the February, 1946, QST article,(1) except in size.
Constructing the Basic Map
Upon the world chart, Fig. 1 of the CRPL publication, draw in heavy black lines a series of six great-circle paths passing through the location of your station and extending from this location to the borders of the chart in each great-circle direction at 30-degree angles around the compass. This is done by means of the great-circle graph, Fig. 2 in each issue of the CRPL publication (see Fig. 6 of the February, 1946, QST article'), as follows: Upon a sheet of tracing paper or thin transparent paper approximately the size of the CRPL Fig. 2, trace from that chart the Equator and three perpendicular lines corresponding to the points of convergence of the great circles on that figure. On the center vertical line, from the world chart, CRPL Fig. 1, mark as accurately as possible the location of your station. Using a 30-60-90-degree triangle, draw short lines passing through the location of the station at 30-, 60- and 90-degree angles to the perpendicular line. Great-circle paths are next drawn in by moving the tracing paper horizontally (maintaining coincidence between the Equator lines) and drawing each of five great-circle paths which pass through the location of your station tangent to the short 30-6090-degree lines previously drawn in, using the closest great-circle paths of CRPL Fig. 2 as guides. The perpendicular lines represent the sixth great circle running due north and south through the location of your station. From right to left, these great-circle curves, including the perpendicular lines, represent bearings from the station location of zero through 360 degrees at 30-degree intervals.
Next, on each great-circle path, distances 2000 kilometers each side of the home-station location are spotted from the dot-dash lines of Fig. 2 of the CRPL publication. These points are then connected by a smooth curve to outline the control area, 2000 kilometers (1250 miles) in radius.
The curves and the control area are next transferred to your basic world chart, making certain that the locations of the home station and the Equator are properly positioned during the transfer.
Because of the type of world-chart projection used, the periphery of the control area will not be a circle but will take the shape of an egg or a spinning top with its point toward the Equator. The Equator on this world chart should be drawn in as a heavy horizontal black line from border to border. Also, the central meridian of the time zone in use at the amateur's station, e.g. 75, 90, 105 or 120 degrees for Eastern, Central, Mountain or Pacific Standard Time, respectively, should be drawn in as a short, heavy vertical black line at the Equator, for use in reading time from the time scale on the transparent chart to be described later. It will be found convenient to color the land areas on the world chart using different colors (light red, green and blue are recommended) for the land areas falling in the E, I and W portions of the world chart. The chart thus constructed can be used as a basic chart for predictions from month to month thereafter at various amateur frequencies, and for these reasons it is best to mount this basic chart upon heavy cardboard or upon a piece of smooth wood, using vegetable glue or similar adhesive.
Incidentally, this basic world chart with its great-circle paths will be a good guide to the direction in which that rotary beam should be pointed to make the DX contacts predicted from the charts.
Prediction charts
To be used with the basic chart, a transparent chart is prepared, preferably upon a roughened cellulose (although thin white tracing paper may be used), by tracing in part from Figs. 6, 8 and 10 of the CRPL publication. A permanent horizontal line representing the Equator is traced in ink on the transparent chart and a permanent horizontal scale of hours also obtained from the same figures, is entered on the chart, most conveniently along the Equator line. Upon the transparent chart there are traced, from the F2-4000 charts of the CRPL publication for the month for which predictions are desired, "contour" lines corresponding to the amateur frequency which is in use, or the high frequency of the band in use (e.g. 30 megacycles for 10 meters). These "contour" lines should be traced from the E, I and W F2-4000 charts, preferably in colors corresponding to those used upon the basic chart for the land areas lying in the E, I and W zones respectively. Contour lines for succeeding months can be transferred to the transparent chart after erasing such lines for the previous month, if traced with pencil. Or, if it is desired to know "conditions" for several months in advance, several transparent charts can be prepared for use with the one basic world chart.
Making predictions
Once constructed, the charts are easily kept current and easily used. In use, the two charts are always positioned vertically so that their horizontal Equator lines coincide. For this purpose guides may be associated with the basic world chart which will permit the transparent chart to be moved only in a horizontal direction.
The transparent chart is slid horizontally so that the contour area outlined thereupon first touches, then overlies and later passes out of contact with the periphery of the control area on the world chart. The proper E, I or W contour areas for the zone in which the control areas lie should be used, of course. The band begins to open up at the time of first contact between the contour area and the control area, and remains open until there is no further contact between these two areas; time is read from the transparent chart, using the time scale along the Equator at the point which coincides with the vertical line on the world chart corresponding to the central meridian of the time zone at the amateur's location.
World areas that can be contacted during the period that the band is open, as worked out above, can be read directly from the charts. Since radio signals travel by great-circle paths, and since propagation is primarily controlled by the condition of the F2 layer at the control points, it is only necessary to ascertain when the control points along these paths, i.e., a first point on the periphery of the control area and any other second point along that great-circle path, become effective at the desired frequency, to ascertain what can be worked along that path 1250 miles beyond the second control point. In other words, by means of the two charts, the time at which the first control point on any great-circle route becomes effective, and the location of all second control points along that great-circle route, are presented visually to permit a quick answer to the question "What are present conditions?"
Allowance should be made for the zones in which the control points are located, using the proper contour areas for each zone (e.g., the control points for red, blue and green land areas should fall within the red, blue and green contour areas). Additionally, it should not be overlooked that land areas 1250 miles beyond the contour areas along great-circle paths may be worked as long as both control points fall within the proper contour areas for each zone.
The use of the charts is much simpler than any instructions as to how they are used, and Figs. 1, 2, 3 and 4 of this article may illustrate this. Fig. 1 shows the basic world chart constructed as outlined above for an amateur station located in Washington, D. C. The control area is shown in close-ruled lines and great-circle paths at 30-degree intervals are shown. A vertical line corresponding with the 75th Meridian West is used for reading time along the time scale on the transparent chart. Fig. 2 shows the transparent chart with 30-megacycle contour lines for the E, f and W zones for the month of April, 1947.
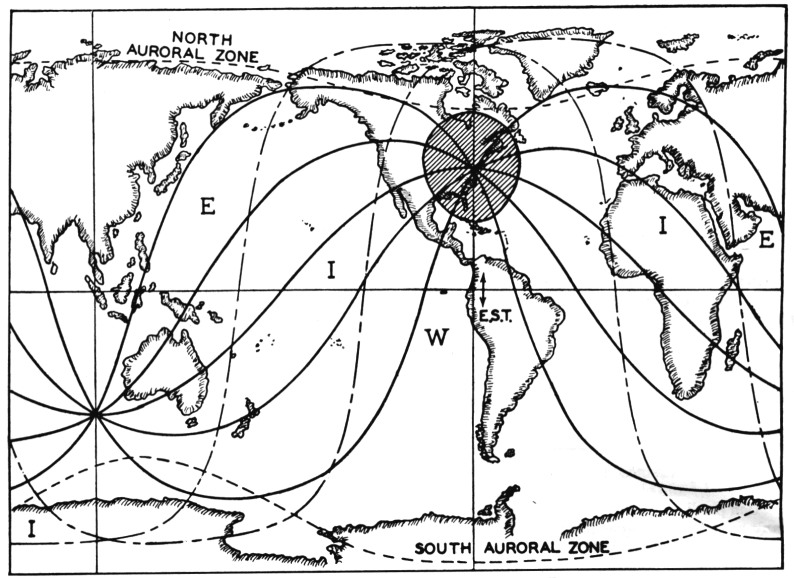
Fig. 1. The basic map will resemble this one constructed for Washington, D. C., by the author. Each of the heavy curves (including the vertical line) represents a great-circle path, intervals between curves being 30 degrees of azimuth at the home location. The short double-arrowed vertical line marks the EST meridian.
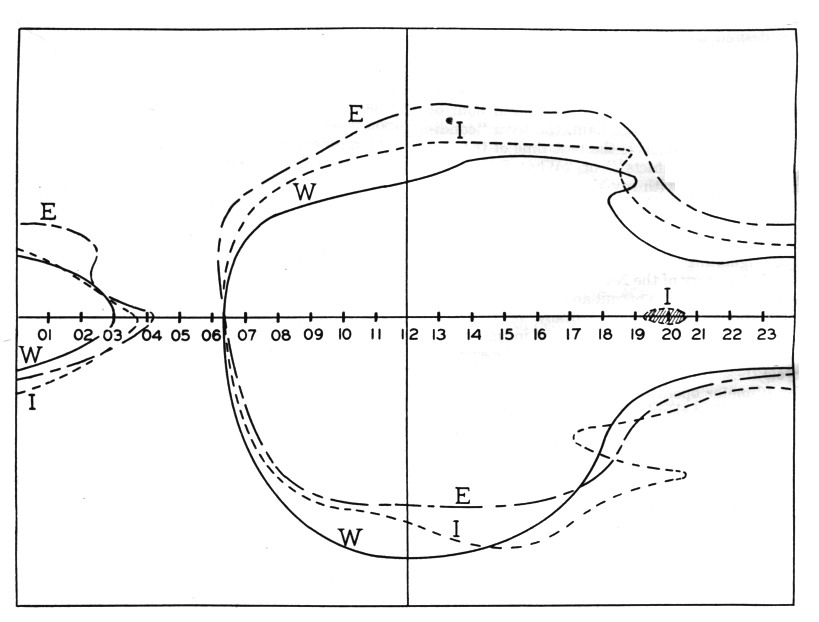
Fig. 2. The 30-megacycle F2-4000 m.u.f. contour lines traced from the CRPL prediction charts for April. 1947. The contours for the three zones are superimposed on the same chart so that 10-meter predictions the world over can be observed at a glance.
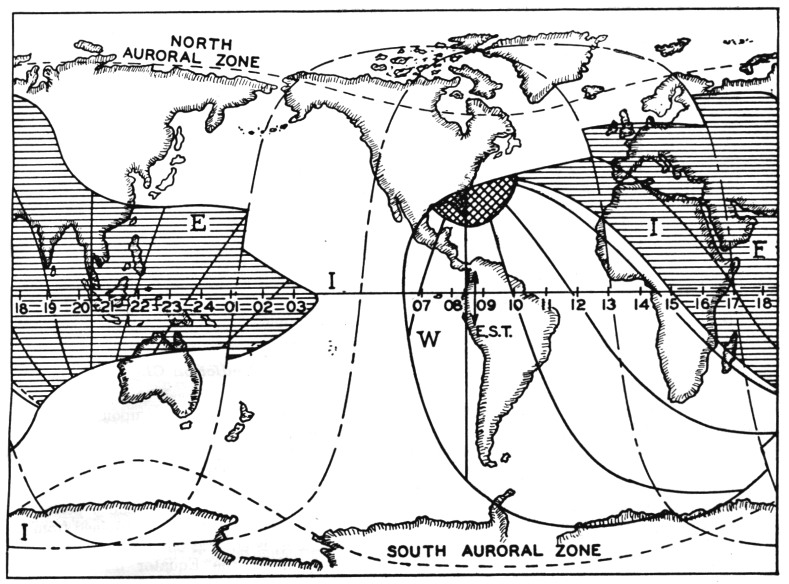
Fig. 3. Conditions, as predicted by the charts, at 8:40 A.M. EST, during April, 1947. The white area that also encloses the lower portion of the home-station control area represents the part of the world that is "open" for 10-meter communication. Shaded areas cannot be worked over the short great-circle route, but are "possible" by the long path.
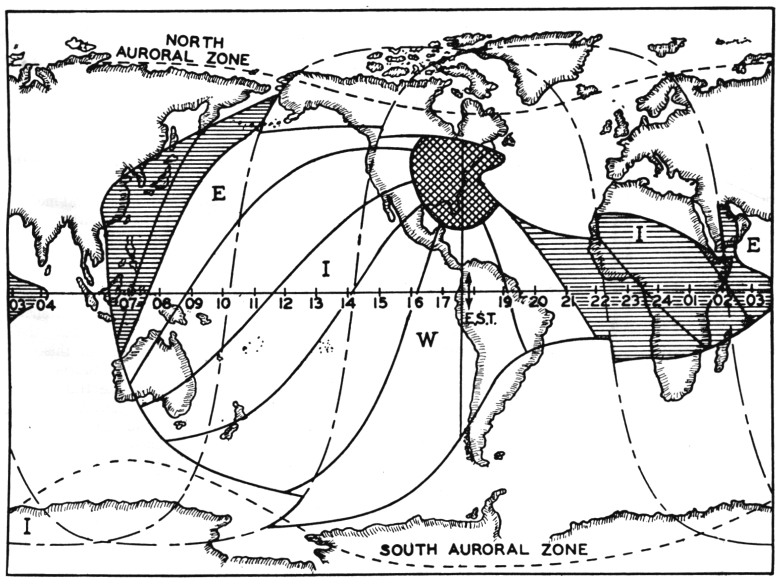
Fig. 4. Corresponding to Fig. 3, but for 5:50 P.M. during April.
| Date (1946) | Station | Location | Predicted Open Period | Time (EST) Heard or Worked |
|---|---|---|---|---|
| Oct. 5 | G5JY | Birmingham, England | 0730 - 1340 | 0826 |
| 5 | D4AIW | Germany | 0730 - 1300 | 0831 |
| 5 | PA0WJ | Holland | 0730 - 1310 | 0838 |
| 6 | ZS2AZ | East London, S. Africa | 0600 - 1530 | 0735 |
| 6 | ZS1BV | Capetown, S. Africa | 0600 - 1530 | 1508 |
| 13 | VU2AQ | Bombay, India | 0930 - 1020 | 1010 |
| 13 | K6OQE | Honolulu, Hawaii | 1100 - 1940 | 1216 |
| 17 | LU7BU | Buenos Aires, Argentina | 0710 - 1810 | 1737 |
| 26 | FA8DX | Algeria, N. Africa | 0620 - 1220 | 1017 |
| Nov. 3 | G8MX | Herts., England | 0640 - 1240 | 0738 |
| 3 | LA8C | Oslo, Norway | 0720 - 1100 | 0844 |
| 3 | D4AAC | Frankfort, Germany | 0650 - 1145 | 0923 |
| 3 | PA0DR | Holland | 0700 - 1200 | 0918 |
| 9 | ZS1BC | Capetown, 8. Africa | 0550 - 1620 | 0638 |
| 9 | PZ1A | Dutch Guinea | 0600 - 1700 | 0703 |
| 20 | F7AA | Paris, France | 0630 - 1250 | 1207 |
| 20 | HC1FG | Quito, Ecuador | 0650 - 1800 | 1420 |
| 23 | KH6GH | Hawaii | 1050 - 1920 | 1841 |
| 27 | GW5VX | Glam., 8. Wales | 0640 - 1250 | 0652 |
| Dec. 8 | G6GF | Lines., England | 0740 - 1140 | 0744 |
| 8 | D4APN | Nr. Frankfort, Germany | 0740 - 1110 | 0749 |
| 14 | XAFM | Naples Italy | 0715 - 1120 | 0743 |
| 22 | HC1FG | Quito, Naples, | 0730 - 1720 | 1201 |
| 22 | G4KY | London, England | 0740 - 1140 | 0825 |
| 27 | PA0NO | Maassluis, Holland | 0740 - 1100 | 0750 |
| 28 | SM7SV | Sweden | 0810 - 0930 | 0825 |
The numerals along the Equator constitute a "local-time" scale, and can be read directly as Washington time using the 75th-meridian vertical line on the basic chart. Fig. 3 shows the basic and transparent charts superimposed at 8:40 A.M. while Fig. 4 shows the same charts superimposed at 5:50 P.M. From these figures, "conditions" on ten meters at these hours can be easily observed and DX contacts can be predicted readily. With the actual charts, the times at which various world areas come in and go out can he predicted with considerable accuracy.
Areas falling within the contour lines and designated by horizontal rulings are "visible" but not "workable," since great-circle paths passing through these areas do not enter the home-station control area at a point falling within the contour lines. However, it may occasionally be possible to work these areas by the long great-circle paths, as may be seen by a study of the charts, and it is probable that this accounts for statements occasionally heard over the air going something like this: "I worked into the Philippines off the back of my beam, and at 8:30 in the morning! Imagine that!"
Reliability
General correlation of predicted "conditions" and stations heard or worked on 10 meters over a period of several months late in 1946 is shown in the accompanying table. This table compares predictions made in the manner described above with actual observations from the author's amateur station located near Washington, D. C. Differences in predicted "open" periods from month to month will be apparent. Only representative data are given, although the predictions have been confirmed by a large number of observations.
Tables showing predicted " open" periods could be worked out for any station location from these charts, but the charts themselves are much more informative and more easily used. Tables can only define areas generally, and would be quite lengthy if made complete.
Predicting amateur "conditions" in the foregoing manner is, of course, subject to certain limitations just as is the predicting of weather conditions. The recommended method is based upon maximum usable frequency since it is felt that the average amateur wants to know what he might usually work and not what he can be certain of working based on optimum usable frequency. Certain errors may occur because of the world-map projection used, and may also result from the method of drawing great-circle paths on this projection. Additionally, ionosphere storms, warnings of which are sent out by WWV at 20 minutes after and 10 minutes before every hour:1 may disrupt normal communications. In general, attenuation of signals becomes greater as the difference between maximum usable frequency and operating frequency becomes greater. Each of these factors could result in an amateur not making contact in accordance with the predictions. On the other hand, sunspot peaks (at twenty-seven day intervals), sporadic-E and other factors might permit contacts to be made at times other than those predicted by the foregoing method. In any event, it is believed that a much better picture of amateur "conditions" can be predicted by this method than has heretofore been possible, and if charts are constructed and used as described above, the DX hound will have another handy tool in the radio shack.
Notes
- W.R. Foley, "Forecasting long-distance transmission," QST, February, 1946.
- E.H. Conklin, "The bright new world - of sunspots," QST, January, 1946.
- Newbern Smith & Richard Silverstein, "Radio propagation work at the National Bureau of Standards," QST, May, 1946.
- 0.P. Ferrell, "DX predictions," CQ, August-December, 1946.
- P. 46, QST, August, 1946.
Newell A. Atwood. W3STR.