Versatilize your oscilloscope
Adding a Z-axis amplifier and voltage calibrator.
This article describes the circuitry and construction involved in adding a Z-axis amplifier and voltage calibrator to any oscilloscope lacking these refinements. The Z-axis amplifier may be used for trace brightening, Z-axis modulation, or retrace blanking and, with the voltage calibrator, the measurement of any wave-shape on the screen is available at the flick of a switch.
The addition of a Z-axis amplifier and voltage calibrator to any scope provides a useful asset and is not a difficult job. The oscilloscope pictured in this article is a Heathkit model 0-7, but the same technique may be applied to any scope, providing necessary space for mounting the parts can be found. In this case, very little space was available immediately behind the front panel, so two small subchassis were fabricated and set back on the main chassis with extension shafts run through panel bushings for the control knobs. As shown in the front-view photograph, the added rows of controls are placed midway between the existing controls with the voltage calibrator on the left side, and the Z-axis amplifier on the right.
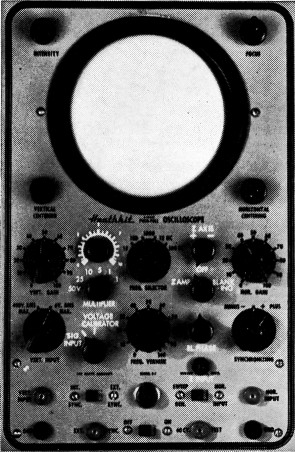
Front-panel view of the scope with the additional controls.
Voltage calibrator
The voltage calibrator (Fig. 1) consists of a free-running symmetrical multivibrator (V1) operating at approximately 1500 c.p.s. Its output is taken off the plate of Vie through C1 to the top of the diode load resistor, R1. V2A is connected as a diode and functions as a clipper to square the waveshape. The plate of V2A is direct-coupled to the grid of cathode follower, V2B, and the output voltage of the calibrator appears across the cathode-resistor string, R6 to R10. The maximum peak-to-peak voltage in each position of S1, as indicated, may be taken from the arm of the switch and attenuated through the gain-control potentiometer R11.
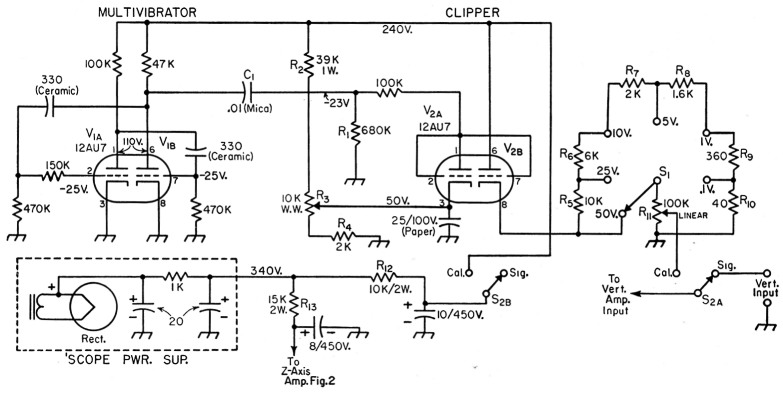
Fig. 1. Circuit of the voltage calibrator. All resistors % watt, unless otherwise specified.
| R11 | Ohmite CU-1041. |
| S1,S2 | Rotary switch. |
Z-axis amplifier
The first tube in the Z-axis amplifier (Fig. 2) is a 12AU7 duo-triode acting as a phase inverter. The cathodes of both sections are tied together using the same cathode resistor, R14. The second section operates as a grounded-grid amplifier. Signals from the plate of each section to the ends of the center-tapped potentiometer R15 are equal and 180 degrees out of the phase. This potentiometer must be linear, with 25,000 ohms each side of center tap. The tube gives a gain of four for each phase.
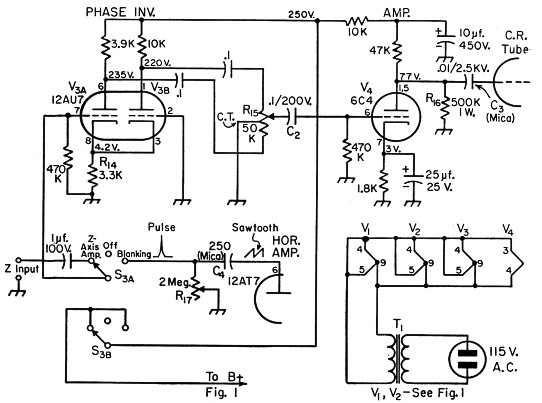
Fig. 2. Schematic of the Z-axis amplifier. All resistors ¼ watt unless otherwise specified.
| R15 | Centralab BT-33. |
| S3 | Rotary switch. |
| T1 | 6.3 volts, 2 amp. |
The signal is then taken from the arm of the gain-and-phase-control potentiometer, R15, through C2 to the input grid of V4. V4 is a triode voltage amplifier with a gain of 12, thereby giving a total gain of 48 through the amplifier in either a positive or negative direction. From the plate of V4, the signal is passed on to the top of R16 and through C3 to the grid of the cathode-ray tube. Positive signals at this point brighten the trace, while negative signals bias the tube toward cut-off. C3 must be a high-voltage capacitor to withstand the negative d.c. voltage on the grid of the tube.
Blanking
The pulse for blanking is taken from the oscilloscope horizontal-sweep oscillator and differentiated through C4 and R17. During the slow rise time of the sawtooth sweep, no voltage is developed but the rapid fall in voltage at the end of the sawtooth develops a pulse at the junction of C4 and R17, which is impressed on the grid of V3A through S3A when in its blanking position. The size and width of this pulse is adjusted by R17, and R15 is adjusted toward its positive position, putting a positive pulse on the grid of V4 which, in turn, puts a negative pulse on the grid of the cathode-ray tube, thus biasing the grid to cut-off, and blanking during the retrace.
Construction
The material used in the construction of the two subchassis is 0.026 inch copper sheet, since it is easily worked. They were cut out, drilled and bent to shape in a small vise, as shown in Figs. 3A and 3B.
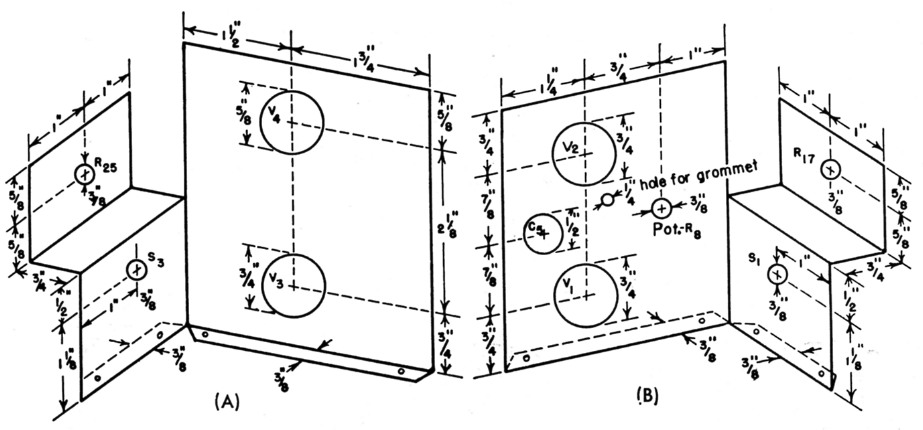
Fig. 3. Sketch showing dimensions of the two subchassis. The one to the left is for the Z-axis amplifier; the one to the right is for the voltage calibrator.
A photograph shows the voltage-calibrator chassis with the components mounted and wired. The calibration potentiometer, R11, is shown mounted on the lip of the chassis, with the multiplier switch (S1) just below. The Z-axis amplifier chassis is bent in the opposite direction, with the gain-and-phase potentiometer, R15, mounted on the lip, and the selector switch S3 below. These four controls are reached with extension shafts through panel bushings, the remaining controls being mounted on the front panel.
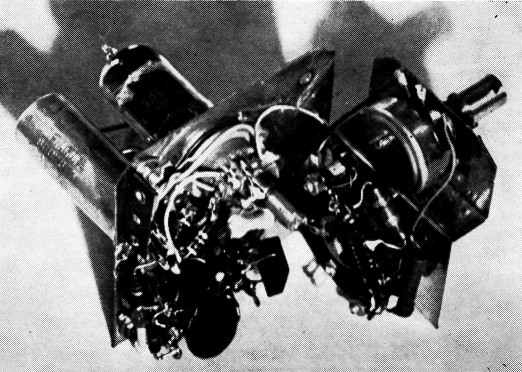
Voltage-calibrator subchassis wired and ready for installation.
In the photograph of the voltage calibrator, the potentiometer shaft, R3, may be seen extending through the chassis where it is available after assembly for adjustment of the voltage-calibrator output. The potentiometer is mounted between the tubes on the top side of the chassis, its leads being fed through a small grommet to the underside.
Both amplifiers should be completely wired according the schematics, leaving signal, B+ and heater leads long enough to reach their connections. Wiring is not at all critical and point-to-point wiring was employed to conserve space.
The holes in the front for the added controls are all 3/8 inch diameter. The hole for the shaft of the voltage-calibrator gain potentiometer, R11, is centered 2¼ inches above the main chassis, and midway between the oscilloscope vertical-gain and frequency-selector controls. The hole for the shaft of the multiplier switch, S1, is 1_1/8 inches below.
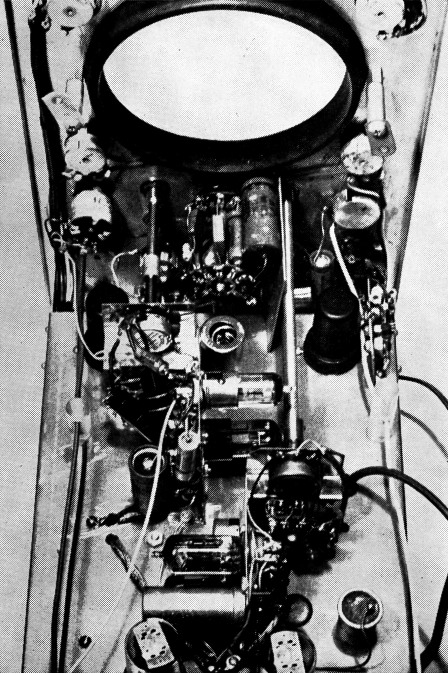
Rear view of oscilloscope with the cathode-ray tube removed, showing the added subassemblies. The voltage calibrator is in the foreground, and the Z-axis amplifier above and to the left.
The voltage-calibrator switch, S2, is mounted on the panel in the most available position between the oscilloscope vertical-input attenuator switch and the vernier frequency control.
The hole for the shaft of the Z-axis gain and phase control, R15, is centered 2¼ inches above the main chassis, and midway between the frequency-selector switch and the horizontal-gain control. The hole for the shaft of the selector switch, S3, is 1_1/8 inches below. The blank-phase potentiometer, R17, is mounted on the panel midway between the frequency-vernier and synchronizing controls. The Z-axis input jack is located just above the horizontal input switch.
The placement of the two subchassis, with their extension shafts through the panel bushings, is shown in the rear-view photo of the scope. The Z-axis amplifier chassis is on the left side of the photograph, just behind the scope horizontalsweep-amplifier tube (6J5) and the voltage-calibrator chassis is on the right in front of the power-supply rectifier tubes.
The Z-axis amplifier draws only 8 mA in operation, and the voltage-calibrator requires 10 mA, so they may be operated from the oscilloscope power supply, as shown in Fig. 1. The power-supply output voltage is 340. This potential is dropped to 240 volts through R12 for the voltage calibrator, and to 250 volts through R13 for the Z-axis amplifier. In the calibrate position, Sen puts plate voltage on the calibrator, and San has the same function for the Z-axis amplifier. It is necessary to provide another filament source for the tubes, so a small filament transformer, T1 in Fig. 3, is mounted alongside the power transformer, under the main chassis.
After the units were installed and the wiring completed, switch positions on the front panel were labeled with decals as shown. The voltage-calibrator multiplier switch shows maximum output voltages of 50, 25, 10, 5, 1 and 0.1. These voltages may be attenuated at each position with the gain potentiometer, R11, which is calibrated in tenths on the front panel.
The only adjustment necessary after completion is to set the output level of the voltage calibrator. This calibration is in peak-to-peak volts which is equal to 2.88 r.m.s. voltage. Dividing the maximum output voltage of 50 by 2.88 is equal to 17.4 volts r.m.s. Turn on the oscilloscope, put S1 in the 50-volt position, and turn up the gain pot, R11, to maximum output. A square wave should appear on the screen, as shown in Fig. 4 (left), if the horizontal sweep is at a slow rate. However, if the sweep speed is increased, an image such as Fig. 4 (right) will appear. Connect an a.c. voltmeter to Pin 8 of V2 and adjust potentiometer R3 so the r.m.s. output voltage reads 17.4 volts. The calibrator is now ready for operation.
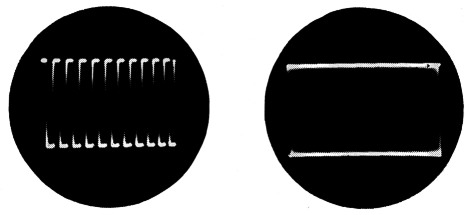
Fig. 4. (Left) Voltage-calibrator square wave with low horizontal sweep frequency. (Right) Same signal with high-speed sweep.
Turn S2 to the signal position, and feed a sine wave into the scope input. Adjust the trace to any convenient height between selected lines on the screen mask. Turn S2 to the calibrate position and adjust the multiplier switch, Si, and gain pot, R11, till the square wave on the screen is at the same height between the previously selected lines. The sine-wave peak-to-peak voltage may now be read by noting the position of the multiplier switch and the percentage of the gain pot used. For example: If the multiplier switch reads 5 and the gain pot 7, there would be an indicated voltage of 0.7 X 5, or 3.5 volts peak-to-peak or, dividing by 2.88, 1.22 volts r.m.s.
Turn S2 to the signal position, put the sine wave back on the scope screen and turn up the intensity control so both the sine wave and retrace are visible as at Fig. 5 (left). Turn S3 to the blanking position, advance the Z-axis gain control, R13, to its positive position, and advance the blanking-phase pot, R17, until the retrace just disappears as at Fig. 5 (right). The small bit of retrace left on 5 (right) would be eliminated by increasing the gain of the blanking control. At low frequencies most of the resistance in R17 will be needed for blanking, but this becomes successively less as the frequency (speed) is increased.
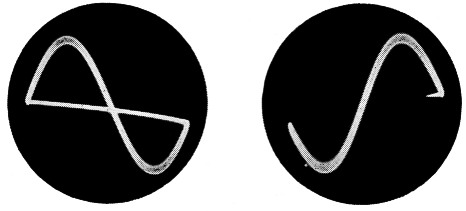
Fig. 5. (Left) Sine wave before return-trace blanking. (Right) Sine wave after return-trace blanking.
Z-axis amplifier
Set the Z-axis pot, R15, to zero (midposition). Turn S3 to the Z-amplifier position. Take the sine-wave injection out of the vertical input and put a sine-wave signal of approximately 1 volt, 1000 c.p.s. into the Z-axis input jack. Set the scope horizontal sweep at approximately 100 c.p.s., and advance the Z-axis gain control toward either positive or negative polarity, readjusting the sweep rate at the same time until the baseline becomes a series of dashes. The number of dashes will show the frequency ratio of the sine-wave input to the sweep frequency and is a handy way to check frequency rate.
Turn the Z-axis pot to zero position. Leave the sine-wave signal on the Z-axis input, and inject the same signal into the vertical input of the scope, placing several cycles on the tube screen. Turn down the scope intensity control until the trace disappears, and advance the Z-amplifier gain control toward positive. The trace should appear similar to Fig. 6 as the cathode-ray-tube grid is driven positive from cut-off by the positive part of the Z-axis signal.
Fig. 6 (left) shows a series of two-microsecond positive pulses which were barely visible on the screen before brightening with intensity modulation, accomplished by injecting the signal into both vertical-input and Z-axis terminals. Fig. 7 shows one cycle of sine wave into the scope vertical input with four cycles of square-wave input to the Z axis, and is another method of checking frequency rate.
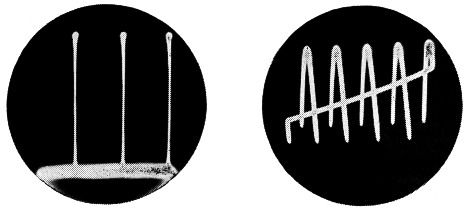
Fig. 6. (Left) Intensity modulation of 2-microsecond positive pulse. (Right) Z amplifier used for trace brightening.
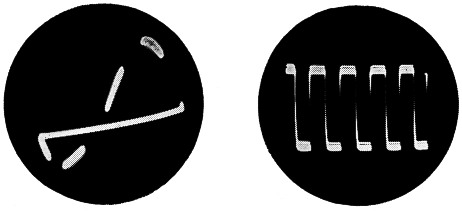
Fig. 7. (Left) One cycle of sine-wave input to vertical modulated by 4 cycles of square wave (right).
Fig. 8 (left) shows the horizontal baseline with a marker-signal input to the Z-axis amplifier. The Z-axis gain control is advanced toward positive phase, giving a bright marker on the baseline. Turning the gain control toward negative phase puts a hole in the baseline, as at 8 (right).
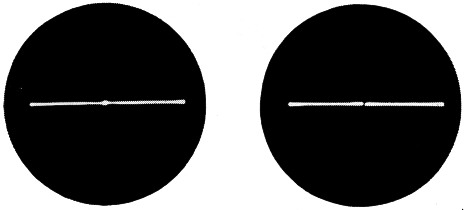
Fig. 8. (Left) Marker-generator signal on baseline. (Right) Markergenerator signal putting a hole in baseline.
Further information on the possible applications of the 2-axis amplifier may be found in Rider's Encyclopedia on Cathode-Ray Oscilloscopes.
Lyle E. Sharpe, W6FSC.