Subinterval markers from a 100 kc. crystal
More on simple secondary standards.
This article is supplementary to one that appeared in the July, 1954, issue. K6DYX shows how additional markers at intervals as small as 6_2/3 kc. may be obtained from a 100 kc. crystal. Included is a series of graphs that help to explain the manner in which the circuit works.
Being in possession of an old and uncalibrated receiver, the article, "50 kc. markers from a 100 kc. Crystal," QST, July, 1954, was of particular interest to me. If this circuit would divide a frequency by two, why not by five, or even ten, and yield markers every 20 or 10 kc.?
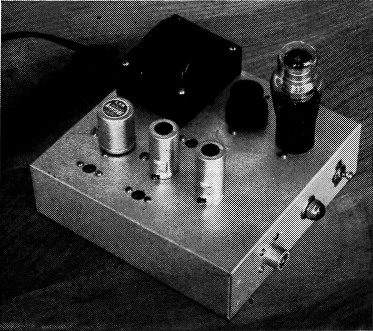
The crystal calibrator unit complete with power supply.
With this possibility in mind and, with the help of H. Minor, KN6JIE, the circuit of Fig. 1 was assembled. We carried out extensive tests and think the results would be of interest to other hams.
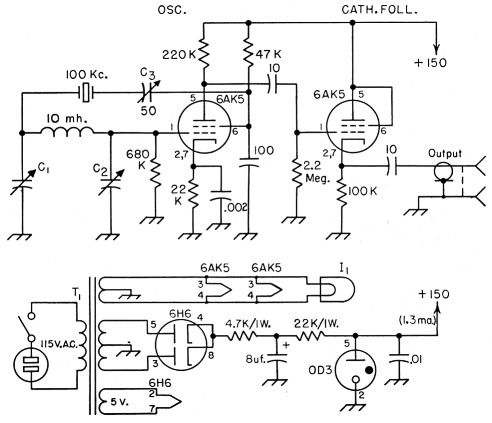
Fig. 1. Circuit for obtaining subinterval markers from a 100 kc. crystal.
All capacitances less than 0.001 µf. are in pF. C1 and C2 are 50 pF air trimmers.
All resistors ½ watt, unless otherwise noted.
T1 - Power transformer: 750 V c.t., 40 mA; 5 V, 2 A; 6.3 V, 2 A.
Circuit operation
It was immediately apparent that the explanation offered in the original article is incorrect. The grid resistor has little effect on the frequency of the subharmonics. The cathode by-pass capacitor is likewise ineffective, although there is an optimum range for both these components in their effect on the stability of operation.
The proper explanation seems to be that the relaxation pulse from the screen circuit is fed to the LC network composed of L, C1 and C2 through the crystal operating at near its series resonant frequency. A transient oscillation is excited in the tuned circuit which, for 50-kc. markers, has a frequency of 350 kc. Thus the grid signal consists of the resonant frequency of the crystal with the frequency of the tuned circuit superimposed upon it (Fig. 2A). The positive crests of this complex wave trigger the tube in such a way that the screen voltage appears as in Fig. 2B, and the output voltage as in Fig. 2C. There is little or no synchronizing action, since the crystal does not feed back any of the 350 kc. frequency present in the screen voltage. The cathode bias is important, because the tube triggers as its grid returns from beyond cut-off, but the capacitor across the cathode resistor serves only to stabilize the bias, and has no direct effect on the frequency. The time constant of the screen circuit should be less than the period of the crystal for strong relaxation pulses. In this case it is 47K × 100 pF = 4.7 microseconds, whereas the period of the crystal is 10 microseconds.
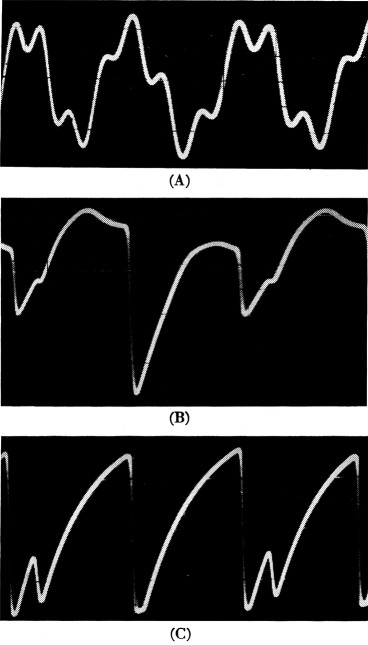
Fig. 2. Oscillograms when circuit is adjusted for 50 kc. markers.
A - Grid voltage. B - Screen voltage. C - Output voltage.
Other subharmonics
The existence of 50 kc. and harmonics thereof in the output voltage is obvious from Fig. 2C. Here every second one of the 100-kc. sawtooths is distorted. According to the theory of operation given above, it should be possible to distort every third tooth by tuning the LC circuit to 333_1/3 kc. and obtain markers every 33½ kc. This was found to be the case. In fact, it was possible in our set-up to distort the sawtooths at any periodicity up to the 15th, yielding markers every 6_2/3 kc.! A series of frequencies to which the LC circuit was tuned, the ratio of these frequencies to the 100 kc. fundamental, and the separation of the marker frequencies is shown in Table I. This is not the only series that will produce subharmonic distortion in this way. A ratio of 3/2, 5/2, 7/2, 9/2, etc., will result in 1/2 frequency harmonics. A formula giving the frequency of the tuned circuit, L with C1 and C2 in series across it, is:
![]()
Where n takes on integral values, F1 is the fundamental frequency, and Fh is the frequency separation of the harmonics it is desired to produce. This formula was verified in our experimental work, but the frequencies shown in Table 1 seemed to work out best.
| Frequency of Tuned Circuit, kc. | Ratio of Tuned Circuit and Crystal Frequencies | Separation of Markers, kc. |
|---|---|---|
| 350 | 7 to 2 | 50 |
| 333_1/3 | 10 to 3 | 33_1/3 |
| 325 | 13 to 4 | 25 |
| 320 | 16 to 5 | 20 |
| 316_2/3 | 19 to 6 | 16_2/3 |
| 314_1/3 | 22 to 7 | 14.285 |
| 312.5 | 25 to 8 | 12.5 |
| 311.1 | 28 to 9 | 11.1 |
| 310 | 31 to 10 | 10 |
Fig. 3 shows the grid-voltage wave and the output-voltage wave when the circuit was adjusted for 10 kc. separation of the markers. Note that the frequency ratio in Fig. 3A is clearly 31 to 10. The adjustment of either C1 or C2 is rather critical because the frequency of the tuned circuit must be within a few hundred cycles of 310 kc. We found it advisable to use a cathode-follower buffer after the oscillator circuit to avoid detuning when we changed loads. Adjusting the fundamental to exactly 100 kc. is also critical, because tuning the LC circuit pulls the crystal a little and it is necessary to readjust C3.
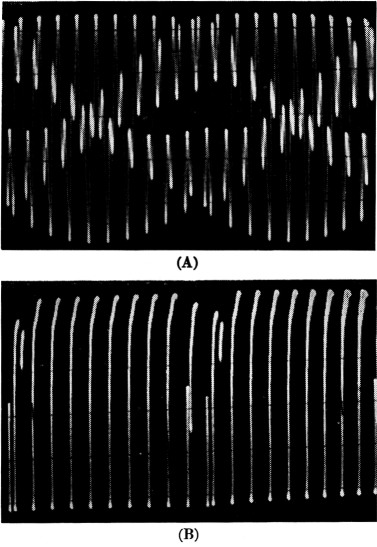
Fig. 3. Oscillograms obtained when circuit is adjusted for 10 kc. markers.
A - Grid voltage.
B - Output voltage.
Adjustment procedure
For our experimental work we had available rather ideal equipment in the way of syncroscopes and frequency counters, but the unit has been adjusted from scratch and used in the home station with very satisfactory results. The best procedure is to establish oscillation, and adjust either or both C1 and C2 until clean markers are heard on the station receiver at 100 kc. intervals. Then tune the receiver to the approximate point where the subinterval marker is desired and adjust either or both C1 and C2 until a clear, clean marker is heard. No difficulty at all was experienced in getting markers every 20 kc., but for closer intervals one should check that there are the required number between the 100 kc. points previously noted. After the marker intervals have been established, zero-beat with WWV by adjustment of C3.
Construction
The unit shown in the photographs includes a cathode-follower buffer stage and a built-in power supply with voltage regulation. The circuits of these sections also appear in Fig. 1. The components are assembled on a 7 × 7 × 2 inch aluminum chassis. The power transformer, 6H6 rectifier and OD3/VR150 voltage-regulator tube are lined up along the right-hand edge of the chassis. At the left are the 100 kc. crystal (at the rear), the oscillator tube, and the cathode-follower tube. A coax output connector, pilot lamp and power switch are set in the front edge of the chassis.
In the bottom view, at the top, C3 is to the left, and C2 to the right. C1 may be seen near the center. Clearance holes have been cut in the chassis so that these three variable capacitors can be adjusted from the top with a screwdriver.
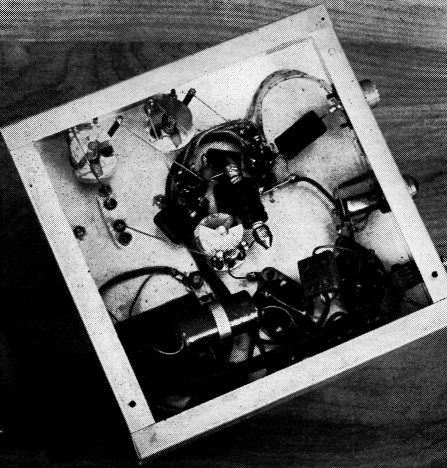
Bottom view of the crystal calibrator.
W.C. Smith, K6DYX.