An expanded-scale a.c. voltmeter
In some measurements, such as a.c. line voltage, only a small percentage of the scale is ever used. This crowds the section of scale of primary interest and reduces the accuracy of reading. WOTHM has a neat arrangement for spreading out the part of the scale that does all the work.
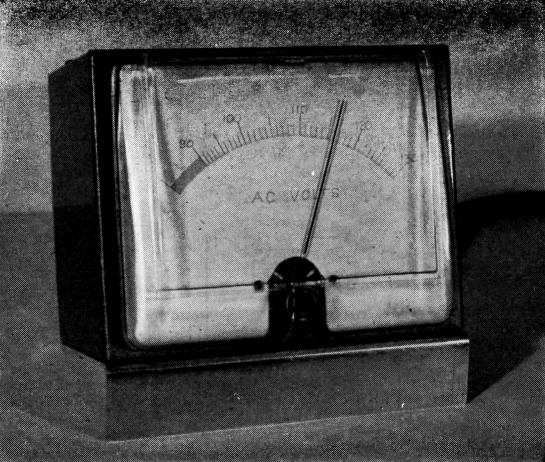
The expanded-scale a.c. voltmeter is mounted in a "Fleximount" type case, with 4 × 5 inch front. The scale is handmade.
"Bandspread" for the a.c. meter.
Douglas Kohl, W0THM.
The utility of an expanded-scale meter need not be discussed in detail: however, at least two important advantages are characteristic of their usage. The "human engineering" aspect of ease of reading in the region of interest improves the over-all accuracy, provided the instrument itself has the appropriate increased accuracy. Secondly, if stable bridge elements are used the quality of the meter movement may be relaxed, thus providing the greater accuracy of a bridge with a substantial reduction in cost.
Most currently available commercial expanded-scale voltmeters employ either costly, carefully-adjusted resistor-inductor networks, tunable - resonant circuits with saturable components, or specially-shaped meter movements. The circuit to be described uses a standard voltage-reference tube as the principal component of a simple expanded-scale meter circuit.
Circuit operation
The expanded-scale voltmeter circuit shown in Fig. 1 functions as follows: During the positive part of the input voltage cycle current will flow through the rectifier, charging up the capacitor and simultaneously delivering a current pulse to the 0B2 glow tube. The OB2 draws current from the instant the capacitor voltage equals the starting voltage of the tube until, as the input voltage descends toward zero, enough of the energy stored in the capacitor is dissipated in the circuit resistances to lower the voltage to just below the extinction point. During the remainder of the cycle the capacitor voltage remains at this value because the rectifier and OB2 are nonconducting. The meter indicates the average value of the current pulse, which repeats each cycle. The magnitude of the current pulses will be nearly proportional to the difference between the input voltage and the operating voltage of the glow tube.
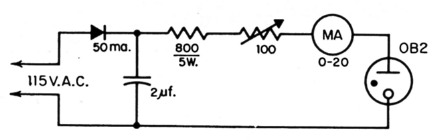
Fig. 1. Circuit of the expanded-scale a.c. voltmeter for reading 90 to 130 volts. The milliammeter used by WOTHM, a shunted 0-200 microammeter, has a resistance of 15 ohms. The 100-ohm variable resistor is a midget wire-wound control. The capacitor is 200-volt metallized paper.
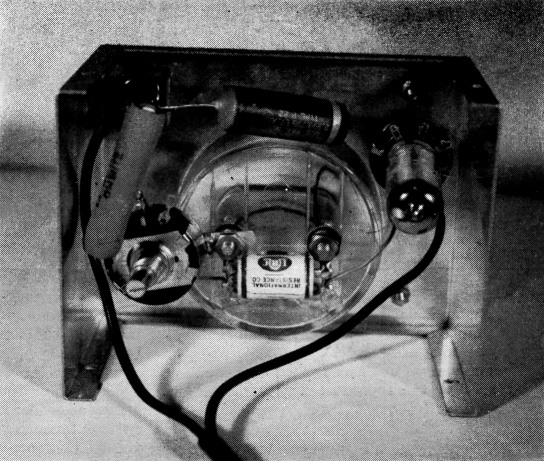
Components are assembled behind the meter, as shown in this view with the box cover removed.
Operation of this circuit at various frequencies up to about 6 kc. is possible with various capacitors. A frequency change of 15 per cent results in very little change in calibration. 1).c. operation is also possible, but with different scale calibration as well as stability characteristics.
Construction
The instrument shown in the photographs was built around a meter removed from a damaged Heathkit.(1) The choice of meter and circuit components is not at all critical nor is the placement of the parts. The meter and the other components need not be in the same enclosure. Be sure to choose a meter which may be easily taken apart to allow for inserting a new dial.
The big problem is that of initial calibration. Access to a 1/10 per cent accuracy a.c. voltmeter is necessary to furnish the accuracy inherent in this circuit. A handmade scale, on the other hand, will blow this value way up, so ½ per cent accuracy is certainly acceptable.
Best results in making the new scale are obtained by using the existing scale and taking numerous readings throughout the range of interest. Set the input voltage at the approximate calibration value and read both the calibrating meter and the other simultaneously (if you can). A curve drawn through all of the points plotted on graph paper will serve as the calibration curve. Use a thin paper overlay on top of the original scale and make pin pricks through this paper corresponding to the desired calibration points on the new scale. These tiny holes are then used to make the new scale by marking through them with the pin.
With a good meter movement the scale will be very linear above 100 volts, becoming slightly crowded between 90 and 100. This circuit provides a 3:1 scale expansion with the standard OB2. The starting point of the scale and range may be altered either by attenuating the input voltage with a resistance voltage divider or by using various other tubes singly or in combination. In this manner practically any lower limit greater than 90 volts can be achieved with OB2s, or less with the large 0A3/VR75 type.
Performance
To check on the stability the instrument was initially calibrated after having been operated for 5 hours. After that it was connected to a wall outlet for continuous operation 16 hours out of each day. Calibration was rechecked with the original calibration meter periodically over a total "on" time of 1000 hours. All measurements were contained within the bars shown in the graph of Fig. 2.
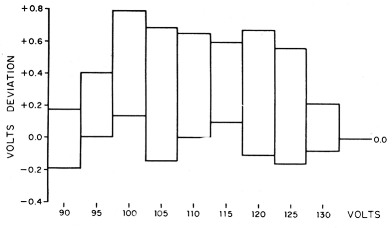
Fig. 2-Long-time stability of circuit (1000-hour test).
Maximum deviation over the entire calibrated range amounted to 0.7 per cent of full scale including all sources of error.
Your chances of duplicating this result are very good because the reproducibility with various OB2s was found to be excellent. A total of eleven picked at random were chosen to establish the practicability of being able to select various tubes and retain the scale calibration. The data in Table 1 show the sample group characteristics arising from one adjustment of the variable resistance for each tube and not, of course, for each voltage reference check point. Five tubes would not give readings below 100 volts so they are included only in the second grouping.
| 6 Tubes | 11 Tubes | |
|---|---|---|
| Mean Voltage | Standard Deviation | Standard Deviation |
| 90.0 | 0.5 | |
| 95.0 | 0.3 | |
| 100.0 | 0.5 | 0.6 |
| 105.0 | 0.3 | 0.3 |
| 110.0 | 0.4 | 0.3 |
| 115.0 | 0.2 | 0.2 |
| 120.0 | 0.2 | 0.3 |
| 125.0 | 0.2 | 0.2 |
| 130.0 | 0.2 | 0.4 |
The calibration adjustments are surprisingly small, which is a reflection of the quality control inherent in the production of OB2s. This is expressed in Table 2 in terms of equivalent volts on the scale.
| Tube number | 90-130 Volt range | 100-130 Volt range |
|---|---|---|
| 1 | -1.6 equiv. volts | -1.8 equiv. volts |
| 2 | -2.2 | |
| 3 | -0.7 | |
| 4 | +0.2 | +0.1 |
| 5 | +0.5 | +0.3 |
| 6 | -2.1 | |
| 7 | -1.6 | |
| 8 | -2.4 | |
| 9 | 0.0 | 0.0 |
| 10 | -0.7 | -0.7 |
| 11 | -0.3 | -0.3 |
Ninety-five per cent of all measurements made with the meter will probably fall within the mathematically normal distribution of deviations so that the maximum errors ever encountered should not exceed 1.2 per cent based on the original calibration.