An inside picture of directional wattmeters
What they do - how they do it.
Instruments for measuring the standing-wave ratio and r.f. power in coaxial transmission lines are becoming increasingly popular. They are not only veryy useful but are becoming almost a necessity in setting up a modern amateur station. It is the writer's purpose to discuss the. differences between some of these devices and to give a clear picture of how they work.
The basic principle of directional coupler operation is common to all of them so it will be discussed first. This will make it easier to understand the differences between the various types.
Standing waves
Fig. 1 shows the voltage and current that can be measured at various points along a transmission line that is not terminated in its characteristic impedance. These are called standing waves because they have a fixed position for any given load impedance. The wave shape is not a sine wave and is not to be confused with the shape of an r.f. cycle. The voltage plotted in Fig. 1 can be measured using an r.f. voltmeter, and the current can be measured by cutting the line at various points and inserting an r.f. ammeter. The readings are the r.m.s. value of the sine-wave r.f. voltage or current existing at each point.
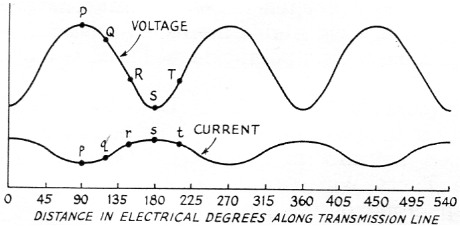
Fig. 1. Voltage and current standing waves as a function of distance toward the load along a lossless transmission line.
Forward and reflected components
Textbooks tell us that the voltage on a line can be considered to have two components: a forward component, EF (sometimes called the incident component), and a reflected component, ER. As shown in Fig. 2, the phasor sum of EF and ER represents the actual r.m.s. voltage, E, at any point along the line. When the two components are in phase a voltage maximum occurs and when they are out of phase a voltage minimum occurs. The same is true of current.
An important thing to note is that at any point along the line the reflected components of voltage and current are exactly 180 degrees out phase. This agrees with the well-known fact that a voltage maximum occurs at a current minimum, and vice versa.
Forward and reflected power
The forward power in the transmission line is 2
![]()
where Z. is the line impedance. The reflected power is
![]()
The actual power, P, delivered to the load is the forward power less the reflected power
![]()
This is all fine and dandy, but we need some way of measuring the forward and reflected components of voltage and current to make much practical use of it. This is what a directional coupler does.
How the directional coupler works
The directional coupler can sense either the forward or reflected component by taking advantage of the fact that the reflected components of voltage and current are 180 degrees out of phase while the forward components are in phase. A small voltage derived from the current in the line is added to a sample of the voltage across the line. If these two samples have the right amplitude relationship, the two reflected components cancel. The sum then represents only the forward component. By reversing the phase of the current sample 180 degrees, the forward components cancel and the result is the sum of only the reflected components.
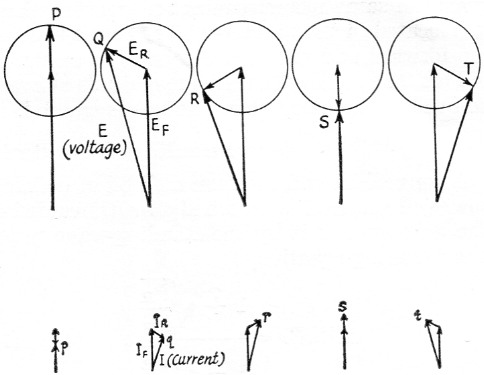
Fig. 2. (A) Phasor diagrams of forward and reflected components of voltage of several points along the transmission line.
(B) Phase relationships between forward and reflected components of current at points corresponding to those in A. The letter designations are this same as in Fig. 1.
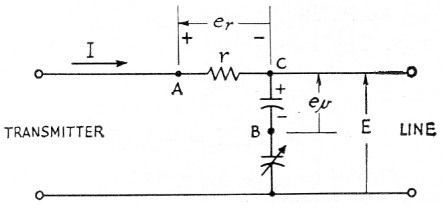
Fig. 3. The basic "Micromatch" circuit. With proper circuit constants, the voltage between A and B is zero for the reflected wave, hence any voltage that appears between these two points is caused by the forward wave.
By reversing the transmitter and antenna connections, the current will flow through the resistor in the opposite direction. This reverses its + and - signs and the voltage across the detector is the difference between the two voltages, so the meter will indicate the reflected component. This is illustrated by the phasor diagrams of Fig. 4.
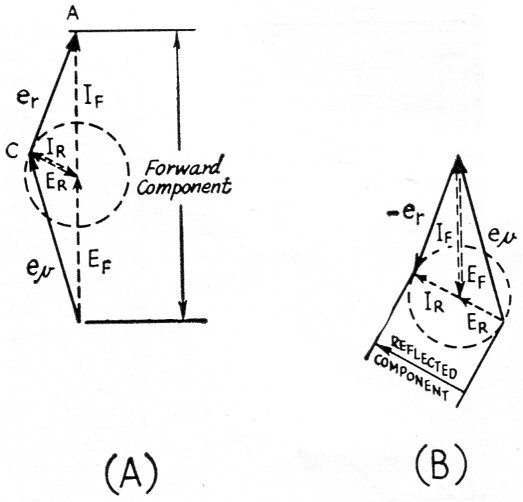
Fig. 4. Phasor diagrams showing current-voltage relationships existing when the Micromatch circuit of Fig. 3 is connected in the line at point Q, Fig. 1. (A) Connected to read forward component; (B) connected to read reflected component.
As mentioned previously, the amplitude of ev must be adjusted so that its reflected component is equal and opposite to the reflected component of er. When this condition exists the forward components are also equal in magnitude but are hi phase. To achieve this balance the variable capacitor in the voltage divider is adjusted so the reflected-power meter reading is zero when the line is terminated in its characteristic. impedance. A good dummy load with zero reflection coefficient is used for this adjustment.
The voltage at the diode detector is derived half from the current, I, and half from the voltage, E. It doesn't matter what you call it, so we'll just call it a voltage proportional to the forward or reflected component. As stated previously, the power varies as the square of either voltage or current. It follows, then, that power also varies as the square of the forward and reflected components detected by the directional coupler. The meter scale can be calibrated to read power directly. If the voltmeter is linear its scale calibration will follow a square law as shown in Fig. 5. One-quarter power is at half scale and one-sixteenth power is at one-fourth scale. In other words, the meter scale is made to do the squaring required by equation (1).
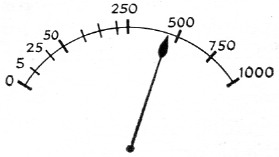
Fig. 5. Square-law scale for a directional wattmeter. For any full-scale power calibration, calibration points for a linearly-calibrated scale (such as is on a d.c. milliammeter) can be found from S√(x/W), where S is the maximum value of the linear scale, x is the value of power to be calibrated, and W is the maximum power (full scale value coinciding with S).
A very useful property of this device is that it gives the same meter readings no matter where it is located in the standing wave. This is because the forward and reflected components as shown in Figs. 2 and 4 have the same magnitude at every point along the line, when line loss is ignored.
Standing-wave ratio
A convenient and common method of defining how well the load is matched to a transmission line is to express it by the standing-wave ratio. The following equation,
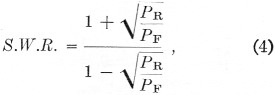
can be used to calculate s.w.r. from forward and reflected power measurements. A new chart, Fig. 6, was devised by the writer to eliminate all of this calculating, however. To use it, just find the point where the ordinate and abscissa representing the measured values of reflected and forward power intersect, and read the s.w.r. by interpolating as necessary between the diagonal s.w.r. lines. For example, with 250 watts forward power and 10 watts reflected power, the s.w.r. is 1.5 to 1.
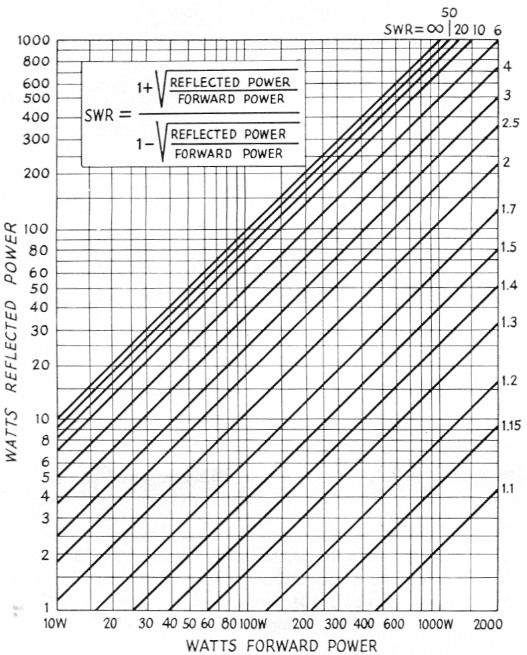
Fig. 6. Standing-wave ratio chart for use with directional wattmeters.
S.W.R. meters
An examination of equation (4) shows that only the ratio of forward to reflected power need be known to establish the s.w.r. In other words, the actual power in watts is unimportant.
An s.w.r. meter, like the directional wattmeter, has a directional coupler for sensing the forward and reflected components. A meter sensitivity control is provided so that when sensing forward power the meter can be set for a full-scale reading. The meter scale can be calibrated to show s.w.r. directly when switched to sense the reflected component. The scale calibration can be theoretically obtained from equations (1), (2) and (4). In practice it may be modified some because the r.f. diode detectors are not perfectly linear, especially at low signal levels.
An important feature of s.w.r. meters is that it is possible to use a simple and inexpensive coupler, since ability to read actual watts accurately is not required. The Monimatch(1) is a typical example. As shown in Fig. 7, a pickup wire placed parallel to the inner conductor samples the line current by inductive coupling. The voltage ei induced in the pickup wire is determined by spacing, length, line current and frequency. The mechanical dimensions determine the mutual inductance, M. The induced voltage due to line current is
![]()
where f is frequency in c.p.s. This shows that the higher the frequency, the larger the induced voltage.
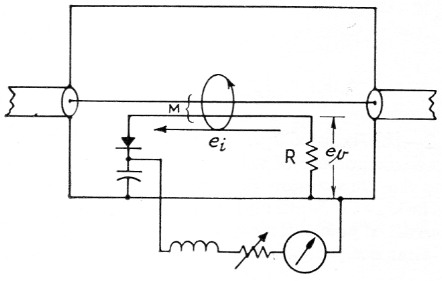
Fig. 7. Basic "Monimatch" circuit.
The sample of voltage is picked up by capacitive coupling from the inner conductor to the pickup wire. A current due to this capacitance flows through R and develops a voltage across it; this voltage also increases with frequency because the reactance of the coupling capacitance goes down with frequency. That is
when Xc is much larger than R. Since the current and voltage pickups both increase with frequency, their ratio will stay the same. The variation in pickup just means that the sensitivity goes down at lower frequencies. This is why the minimum power required to get a full-scale reading is greater on the low-frequency bands.
The j term means that the pickup voltages are 90 degrees out of phase with the line voltage and current. This does not matter, because both voltage and current pickup voltages are shifted in phase. The value of R must be kept very small in comparison with the capacitive coupling reactante, Xc, or a phase error will exist in the amount of ![]() However, the resistance R must not be too small either, because the voltage developed across it depends upon its resistance. Phase error can be caused in the current pickup if the inductance of the pickup wire is appreciable compared with the effective series resistance in the loop. R contributes some of this, but most of the effective series r.f. resistance is attributable to the diode detector and its load circuit. Proper choice of physical dimensions and component values will permit good operation over all h.f. amateur bands. Of course, the voltage and current pickups must be equal, and they are normally balanced by bending the pickup wire to change its relationship to the center conductor?
However, the resistance R must not be too small either, because the voltage developed across it depends upon its resistance. Phase error can be caused in the current pickup if the inductance of the pickup wire is appreciable compared with the effective series resistance in the loop. R contributes some of this, but most of the effective series r.f. resistance is attributable to the diode detector and its load circuit. Proper choice of physical dimensions and component values will permit good operation over all h.f. amateur bands. Of course, the voltage and current pickups must be equal, and they are normally balanced by bending the pickup wire to change its relationship to the center conductor?
Usually, two identical elements are employed, connected in reverse so one senses the forward component and the other the reflected component. To use it, you switch to the forward-power pickup and set the meter sensitivity control to get a full-scale reading, which also is at infinite (oo) s.w.r. Then switch to reflected pickup and the s.w.r. is read directly. To minimize error, both sides should be identical, of course. Actually, a principal cause of error probably is the non-linearity of the diodes. This would show up as a different s.w.r. reading when measuring with low power than when measuring with high power.
In addition to simplicity and low cost, the s.w.r. meter is almost burnout proof and can be calibrated for direct s.w.r. readings.
Directional wattmeter
These instruments are designed to indicate r.f. watts flowing in the transmission line. The s.w.r. coupler just discussed could use a meter calibrated directly in watts, but for a given setting of the sensitivity control the calibration would be good for only one frequency. A preferable coupler circuit is one that is independent of frequency over the desired range. One such type is the "Micromatch" coupler shown in Fig. 3. Another type of coupler is shown in Fig. 8. It has the advantages of eliminating the resistor in series with the line and the attendant heat generated, and it also gets the detector circuit off the "hot" center conductor which greatly simplifies the r.f. choke problem.
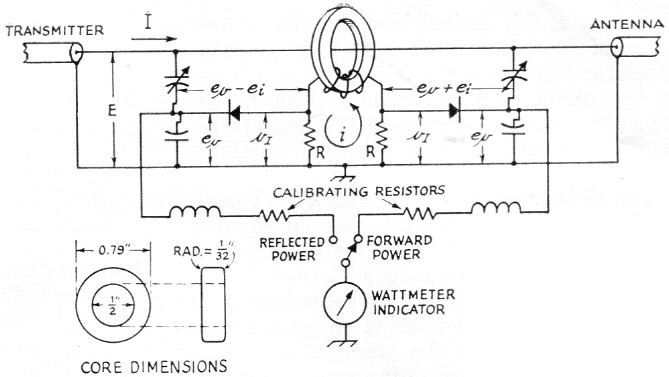
Fig. 8. Directional wattmeter circuit using inductive current sampling. The toroid coil is 60 turns of No. 30 enameled wire wound on a carbonyl E core of the dimensions given. The cores used in the Collins 302C are made by Radio Cores, Inc., 9540 S. Tulley Ave., Oak Lawn, Ill., part No. 57-1541.
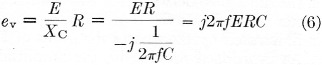
The voltage sample is independent of frequency because it is taken through just a capacitive voltage divider. The current is sampled by inductive coupling to a toroid coil. The line current induces a voltage in the coil and as a result current flows through the coil and its series resistor. The value of resistance is kept small compared with the coil reactance so it has little effect on coil current. The coil current then is determined by the induced voltage and coil reactance:
![]()
The voltage drop across the resistor, R, is iR. Putting all this into one equation for the voltage sample of line current,
![]()
The effect of frequency cancels out because the coil reactance goes up with frequency at the same rate as the induced voltage goes up. Thus the current in the coil is independent of frequency.
One interesting thing that surprises many people at first is that the voltage across the resistor increases when you take off coil turns. The reason is that the reactance varies as the square of the number of turns but the induced voltage in the coil only varies directly with the number of turns. Another point of interest is that the voltage induced in the coil actually does not appear between any two points, providing the circuit isn't opened. The theoretical induced voltage may be 100 volts yet the highest voltage in actual existence is across the series resistor and may be only 1 volt or so.
The useful frequency range is limited at the low-frequency end when the coil reactance becomes so low that the series resistor causes a noticeable phase error. Low values of resistance -10 to 50 ohms - are therefore used. The high-frequency end is limited by the series self-resonance of the coil. Another limitation is the effect of lead inductance of the resistors R which must be kept to an absolute minimum. Proper design for a given frequency range calls for proper choice of coil material, physical size and number of turns.
The meter scale for the directional wattmeter can be calibrated to take into account any diode nonlinearity. Separate scales are generally necessary for different power ranges.
Directional wattmeters have the unique ability to indicate the actual watts of power in a transmission line even in the presence of standing waves. The value of measuring actual transmitter r.f. output needs no elaboration. The s.w.r. on the line can also be determined with the aid of Fig. 6.
Monitoring S.S.B. power level
Directional wattmeters are calibrated with an unmodulated radio frequency. A speech signal or a two-frequency test signal may not give the readings expected unless their peculiarities are understood. The r.f. detectors in directional wattmeters are simple amplitude detectors. This amplitude has to be squared to convert to a power indication.
The average level of speech is quite low as compared with its peaks, and it is generally accepted that the average level is 18 dB below peak. Speech processing or a; good a.l.c. circuit will increase the average level substantially, but because of the nature of speech waveforms and meter response time the meter doesn't kick up as one would like. Ideally, the meter should show actual peak output power. This could be accomplished by replacing the conventional micro-ammeter indicator with a peak-reading instrument. One make of coupler (Collins 302C series) made a substantial improvement by adding a capacitor in the r.f. detector output circuit to make it more of a peak-reading device.(3) It isn't perfect, but this simple addition increases the peak wattmeter reading on s.s.b. voice by about four times. This gives the operator a much better indication of his signal level although it still only kicks up to around 65 per cent of the actual peaks. The meter reads about 77 per cent of actual peak power with a two-tone test signal. The added capacitor has no effect on the single-tone power readings, of course.
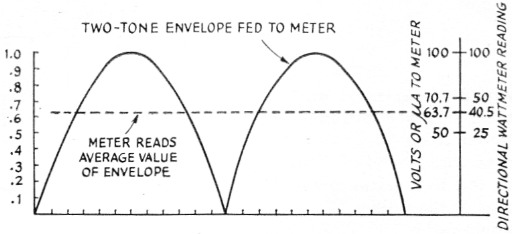
Fig. 9. Relationship between power indicated by an r.f. wattmeter and the actual power in a two-tone test signal, using a directional wattmeter without peaking capacitor.
An instrument without these peaking capacitors should theoretically indicate 40.5 per cent of the actual peak power of a two-frequency signal. Why 40.5 per cent instead of 50 per cent? Let's take a look at Fig. 9. The rectified envelope of a two-frequency signal is the shape of half sine waves. The r.m.s. amplitude is 0.707 of the peak. When squared this gives 50 per cent, which is the actual average power output as a percentage of peak power. However, conventional meters show the average value instead of the r.m.s. value. The average value of half sine wave is 2 or 0.637. Squaring this gives 0.405 or 40.5 per cent. Errors can easily creep in because of distortion, unequal tone amplitudes, and detector nonlinearity. The meter scale squares the total error, also, so power readings up to 10 per cent high are common.
A nice project for the ambitious gadget builder is a peak-reading amplifier for connecting between the coupler and the indicator to show actual peak power. Collins couplers are well suited for this because the indicators have 1000 ohms resistance and all calibration is done in the coupler. A peak-stretching amplifier with exactly 1000 ohms input resistance and unity peak gain will do the job. It may be best to disconnect the 4 µF electrolytic capacitor in this case. Other instruments can also be used by designing the proper input impedance, output impedance and gain characteristics into the amplifier for the particular instrument involved.
Notes
- Measurements chapter, ARRL Handbook; also QST, October 1956 and February 1957.
- The value of R also may he varied to bring about the null reading in the detector circuit, since a change in R changes the capacitively-coupled voltage, eo, across it (and thus the voltage applied to the detector) without affecting the voltage induced through the mutual inductance. This method generally is more "sensitive"-i.e., leads to more pronounced changes in the capacitive/inductive voltage ratio - than changing the position of the coupling wire. - Ed.
- The capacitor must be connected to the detector side of the calibrating resistors. A 4 to 8 µF 6 volt electrolytic is suitable.
Warren B. Bruene, W0TTK.