Actual vs. apparent s.w.r.
Technical Editor, QST:
The following is an easy way of getting the true s.w.r. at the load. This information can be gotten from the Smith Chart, but the method below is easier.
For K' see the accompanying graph.
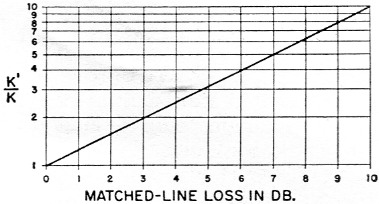
Fig. 1. Graph used in determining the relationship between s.w.r. measured at the transmitter and true s.w.r. at the load, when line losses are appreciable (W9GBD).
Example: Matched line loss = 2 dB and SWR = 3
![]()
From the graph, K' = 1.6 (K) = (1.6) (0.5) = 0.8.
![]()
The value at which K' = 1 corresponds to the s.w.r. (read at the transmitter) with line shorted. Values of K' greater than 1 have no meaning, since higher readings are not possible.
Bob Gold, W9GBD.