Antenna patterns from the sun
Using solar noise for plotting vertical patterns of V.H.F. arrays.
Your v.h.f. antenna is probably aimed at the horizon, but that's not where your signal is going. The radiation in the vertical plane is actually pointed up in the air. This is true whether your antenna is horizontal, vertical or circularly polarized. It occurs because half of the antenna is looking at the ground when it is directed at the horizon. Since the beam strikes the ground, energy bounces off the earth and combines with the energy that is headed skyward.
For a horizontally polarized antenna, which most v.h.f. men use, the reflection is such that the signal is cancelled at the horizon and a sharp beam is formed a few degrees above the horizon. Above this lobe many other weaker and higher-angle lobes are formed. A typical vertical antenna pattern for an antenna a few wavelengths above the ground is illustrated in Fig. 1. A vertically polarized antenna would, if the ground were a perfect conductor, add the reflected and direct signal to produce a lobe with its maximum right on the horizon. But the ground isn't a perfect reflector and it causes the same effect as in the horizontal antenna: a lobe structure that is pointing upward.
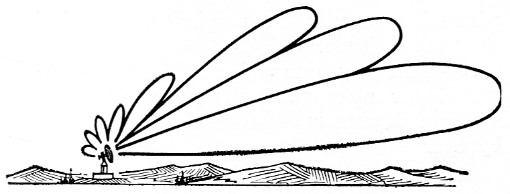
Fig. 1. No antenna ever has a single lobe, aimed precisely at the horizon. As shown in this artist's conception, the main lobe is always at least a few degrees above the horizontal, and other lobes appear above it at higher angles.
The only way to beat this is to raise your antenna up as high from the ground as practical to make the first vertical lobe as low as possible. Even though your antenna is as high as you could put it, it still poses the question: is it really high enough; what would another ten feet in elevation buy? Or another question can come to mind as it did at K2LMG. Is that h.f. array, which is below the v.h.f. beam, acting as a ground plane for the latter, causing a high angle of radiation?
The way to answer such questions is to make a vertical antenna pattern plot. That sounds easy but it can't be done as simply as taking a horizontal radiation pattern. To plot a horizontal pattern all you have to do is to have a nearby friend turn on his transmitter, rotate your antenna, and read his signal strength on your S meter.
Although not so easy as the horizontal pattern, the vertical pattern can be plotted by taking a clue from the radio astronomers. Mother Nature has provided a strong and fairly constant source of radio energy a long way off: the sun. In the course of an afternoon the sun sweeps through a range of elevation angles as the earth turns. If you track the sun in azimuth, you can measure the noise level received by your v.h.f. converter as the sun moves down the vertical plane of your antenna. Using the level of the received signal and the calculated position of the sun, the antenna pattern can be plotted.
By this method the question of the h.f. beam at K2LMG was answered. It showed that there was no interaction. If we have excited your curiosity to the point where you would like to run through this experiment for your own antenna, the method is outlined below.
Solar noise
Since the signal to be received is wide-band noise, the receiver should be opened up to the widest possible bandwidth, so that the greatest amount of noise energy will be collected. But, since this energy is noise a special detectorintegrator voltmeter circuit should be used on the output of the receiver in order to smooth out the variations in the noise for more accurate voltage readings. The receiver should be operated with the b.f.o. set for normal c.w. reception. Connect one of the detector-integrators of Fig. 2 to the audio output. One is for use with a volt-ohmmeter, where R = (lowest full scale voltage) × (voltmeter ohms per volt) and C = 106 / R µF, with at least a 6 volt rating. The other is for use with a vacuum-tube voltmeter. If the v.o.m. is used the detector must be connected to the high-impedance tap (the higher impedance the better) of the receiver audio output transformer. It doesn't matter which audio output is used for the v.t.v.m. circuit. Even a high-impedance headphone circuit can be used. The received signals will be read on the voltmeter.
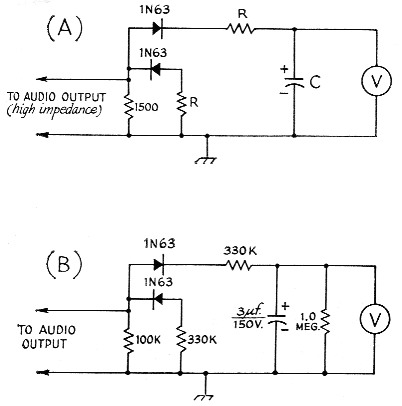
Fig. 2. Detector-integrator circuits for use in taking noise readings. Circuit A is for volt-ohmmeters, B for vacuum-tube voltmeters. See text for information on R and C values in circuit A.
Since the gain of even the very best of receivers will change with time, the effects of receiver gain variations can be removed by putting a resistor equal to the impedance of the transmission line on a coax connector and substituting it for the antenna and transmission line at the converter input just before each reading is taken. Noise from the resistor provides a "standard signal."
Taking data
Data can be taken at either sunset or sunrise. By the method outlined in the following section a graph of the angle to the sun as a function of time should be plotted for the selected day previous to taking data. This graph will then give the beginning and ending times of the test. For a sunset measurement, start at the time of maximum desired elevation angle and continue taking readings until about ten minutes after sunset. For a sunrise measurement you should start about ten minutes before sunrise and continue until the time for the maximum desired elevation is reached.
During the run the horizontal position of the sun will change, so it must be tracked in azimuth. Since your beam is relatively broad in azimuth, probably only a few changes in the horizontal position will have to be made.
The readings should be taken every few minutes, and about once a minute at low elevation angles. Each reading should include the time, the voltage output of the receiver with the resistor substituted for the antenna, and the voltage output with the antenna connected. Set the receiver gain so that the voltmeter is about two-thirds full scale on the most sensitive d.c. scale. At times the sun noise will flare up, or a car will go by the house, so caution should be observed to be sure that the reading of the antenna signal is really a good average value. The reading of the sun won't be much larger than that of the resistor and in fact at times will be lower than the resistor, so don't be alarmed by only small changes of voltage. Since the changes are small, care should be taken to achieve accurate results.
Calculating the sun's elevation angle
The apparent motion of the sun is fairly complicated, and you will have to be prepared to do some work here. If you are interested only in the elevation angles below 15 degrees, and are willing to settle for about 1-degree accuracy, the job isn't too bad. The first step is to find your latitude and longitude from a map, and select a date for making the measurements. From Table 1, look up the sun's latitude on the selected date, interpolating between tabulated dates.
| Date | Sun's latitude | Date | Sun's latitude |
|---|---|---|---|
| Jan. 1 | -23.0 | July 4 | 23.0 |
| 9 | -22.0 | 12 | 22.0 |
| 21 | -20.0 | 24 | 20.0 |
| 29 | -18.0 | Aug. 1 | 18.0 |
| Feb. 8 | -15.0 | 12 | 15.0 |
| 22 | -10.0 | 27 | 10.0 |
| Mar. 8 | - 5.0 | Sept. 10 | 5.0 |
| 20 | 0.0 | 23 | 0.0 |
| Apr. 3 | 5.0 | Oct. 6 | -5.0 |
| 16 | 10.0 | 20 | -10.0 |
| May 1 | 15.0 | Nov. 3 | -15.0 |
| 12 | 18.0 | 14 | -18.0 |
| 21 | 20.0 | 21 | -20.0 |
| June 1 | 22.0 | Dec. 2 | -22.0 |
| 10 | 23.0 | 11 | -23.0 |
| 22 | 23.4 | 21 | -23.4 |
Second, find out what time the sun will set (or rise) on the chosen day. If you live in a large city you can simply consult a local newspaper or the TV weatherman. The authors have found that in smaller cities these sources sometimes quote times which actually apply to a larger city nearby, and are not accurate enough for our purposes. The same applies if you live more than 15 miles out in the suburbs. In this case, find the correct time from one of the references listed at the end of this article, following the instructions given with the tables.
Next, calculate the number A from the following formula:
![]()
where
L is your latitude
D (declination) is the sun's latitude.
Now, for any time which is M minutes before sunset (or after sunrise), the sun's elevation angle in degrees is equal to A times M divided by 4, or
![]()
To extend your pattern to elevation angles higher than 15 degrees you will have to work a little harder. In addition to finding the number A, find another number B from this formula:
![]()
where D and L are as before. Remember that when D is negative, sin D is also negative.
For a time M minutes before sunset (or after sunrise) find an angle X degrees by dividing M by 4. That is,
![]()
Now find the elevation angle Φ from the equation sin Φ = A sin X + B(1 - cos X).
The procedure described above gives the elevation angle of the sun at any time it is above your horizon, to about 1 degree accuracy. To get a better picture of the fine structure of your antenna pattern, especially at the low angles which are most important, better accuracy is needed. About 0.2 degree can be achieved by careful calculation and by applying certain corrections.
Read your latitude and longitude to 0.1 degree or better, and find the sunset (or sunrise) time to the nearest minute. Now adjust this time slightly by 3.3 / A minutes. Add this to the sunrise time, or subtract it from the sunset time. Use this adjusted time to calculate the elevation angles as described above, and then apply a final correction by adding the amount shown in Fig. 3 to the calculated values. These corrections take into account the refraction of the signal (and the light) by the atmosphere, and the difference in size between the radio sun and the visible sun.
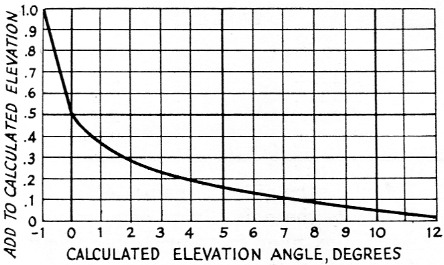
Fig. 3. Chart showing elevation angle corrections to be applied for results of high accuracy.
Finding the sun's azimuth
If you do the job on a sunny day, the simplest way is to have a friend keep the beam pointed toward the sun in azimuth, lining it up by eye. Alternately, calculate the sun's azimuth in advance and rotate the antenna from time to time as required. When readings are taken, the beam should be within about one-fifth of a beam-width of the sun's azimuth:
Azimuth is found from the formula
![]()
Φ is the elevation angle already calculated. Again, remember that when D is negative, sin D is also negative. The azimuth, Θ, is measured eastward from north in the morning, and westward from north in the afternoon. When cos O comes out negative, O is larger than 90 degrees and the sun is more south than north.
Plotting the results
Now that the angle of the sun and the signal-strength readings have been obtained, the antenna pattern can be plotted. Fig. 4 is a curved-earth grid with elevation angles plotted on it. Taking the readings that were made as the sun ran its course, divide the signal voltage from the sun (Es) by the signal voltage from the resistor (ER). Do this for each reading taken. Now square each of these values of (Es/ER) to obtain the value of (Es/ER)2. The next step is to compute the value Y, using the equation
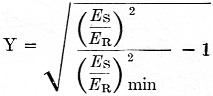
where (Es/ER)2 is each of the readings that were taken as the sun crossed your antenna and (Es/ER)2 min is the value of the reading after the sun is below the zero-degree elevation angle by 5 minutes or more. Then find the greatest value of Y. At this reading, calling it Ymax, assign an arbitrary value of slant range - 500 miles. This is then one point on the plot: 500 miles and the angle to the sun at that time. Now take 500 miles and divide it by Ymas and multiply all of the other Y values by this amount. Plot on Fig. 4 the angle for each signal-strength reading and distance just found. Drawing the curve, you now have your antenna pattern in the vertical plane.
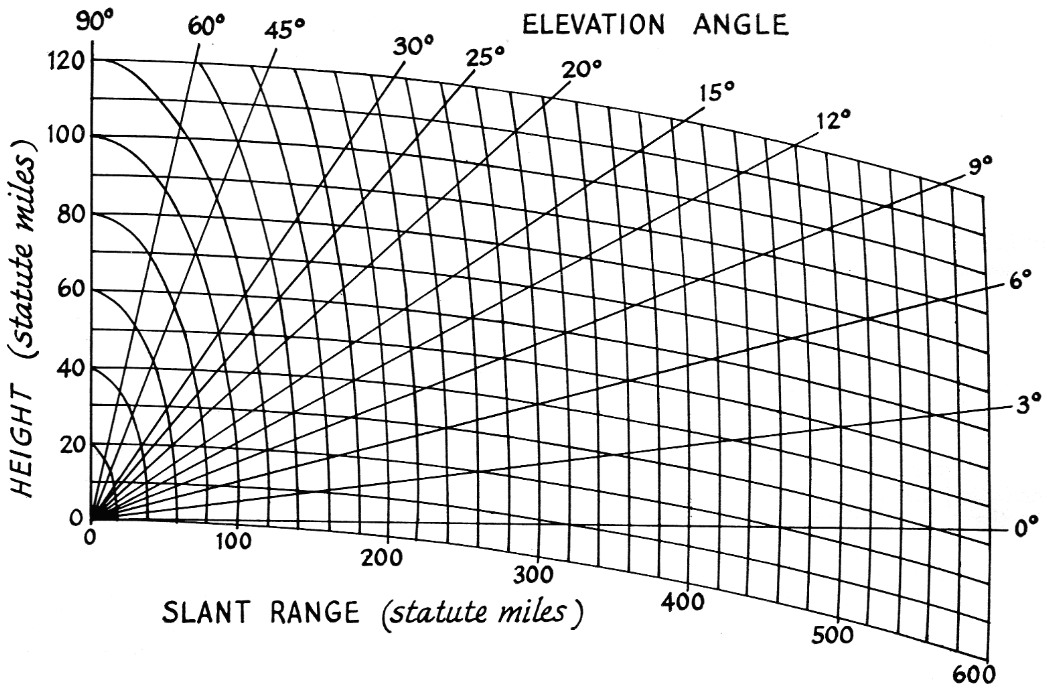
Fig. 4. Curved-earth grid for plotting results obtained from solar noise readings.
There is one caution. The sun is not really a point source of radio waves. It can be represented as a ring of about 1-degree angular diameter on the outside and about one-half degree on the inside. Because of this, the nulls in the antenna pattern will not appear to be sharp. For this reason, a sample antenna pattern is shown in order to guide you in your plot. When the curve shows a dip, it probably is a very deep null as indicated by the dotted lines on the same curve, Fig. 5. Because the depth of the mills cannot be determined, the antenna pattern taken by this method would probably not satisfy an exacting scientist, but in practice the signals that are received on such an antenna, amateur or otherwise, are not from point sources either. Thus the antenna pattern taken by this method is truly an operational pattern.
For those interested in meteor scatter an estimate of optimum range can be made. The me-meteor trails will be most prevalent at a height of 50 miles. From your antenna pattern note the range at which the elevation angle line through the peak of your lowest lobe intercepts the 50-mile height. Multiplying this number by 2 will yield your approximate optimum meteor scatter range. In the example shown in Fig. 5, this would be about 1000 miles.
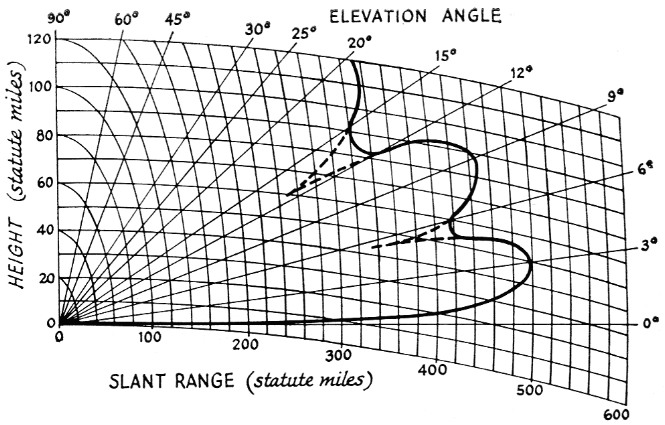
Fig. 5. Representative vertical antenna pattern. Dips in the heavy line represent nulls in the pattern which are actually much deeper than data will indicate. This is due in part to the fact that the sun is not a true point source for radio noise. Antenna pattern may be more like that shown in dotted lines.
Noise figure and antenna gain check
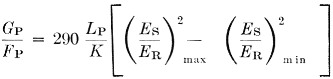
There is another interesting sidelight to this subject. The "quiet" sun is a more or less calibrated source of radio energy. Thus by a few simple calculations you can get an idea of your antenna gain or noise figure for actual received signals. Because the amount of energy that is received is a function of both the noise figure and antenna gain, you can start with one of the known values and find the other. The equation which applies is
where
Gp = the power gain on your antenna
Fp = the noise figure expressed as a power ratio
Lp = the transmission line loss for your cable and your length
K = a constant dependent upon the frequency band
 is the maximum signal ratio from the antenna pattern data taken above. This value will occur at the peak of the first vertical lobe. (Es/ER)2 min is the signal ratio at the time the sun was a few minutes below the horizon.
This formula will only apply when the sun is quiet. If the answers are out of line the test should be repeated until a quiet day is found. A quiet sun radiates the lowest amount of energy; all other conditions produce greater received power.
Your antenna gain is probably the least well-known number of your radio system.
To calculate the antenna gain:
1) Estimate the noise figure of your converter by taking the manufacturer's noise figure, or from tube data if it is a home-brew model. This value will probably be expressed in dB. Convert the db. noise figure to a power ratio by the common dB formula, Fp = antilog F/10 where F is the noise figure in dB from above. This conversion can also be made using the decibel chart in the ARRL Handbook.
2) The factor K is listed in Table II for the various amateur bands above 50 Mc. The 6-meter band has been omitted because of the strong background of radio energy in this frequency range in large areas of the sky, which could adversely influence the results. For the higher bands the background radiation is much less. It is possible that one of the bright radio starb could be near the sun when the measurement is being taken, and would therefore influence the readings on the higher frequencies, also, but the chances of this are remote.
| Frequency Band | Value of K |
|---|---|
| 144 Mc | 2.9 |
| 220 Mc | 2.8 |
| 432 Mc | 2.7 |
| 1296 Mc | 0.6 |
3) L is the line loss. This figure is easily estimated by looking up the transmission-line manufacturer's data for your frequency. It is usually expressed in dB loss per hundred feet. Thus, calculate the dB value for your length and convert the dB loss to a power ratio as you did above for the noise figure.
Substitution of the values in the formula will yield the power gain Gp of the antenna. This can be converted to db. gain by the common formula G = 10 log Gp or by using the Handbook table.
What we have really been talking about here is a practical use of radio astronomy. The methods used here also apply to the detection of radio stars. Many interesting experiments can be performed. For those who are interested, take a radio look at Cygnus A or the center of our galaxy in Sagittarius, when they are rising or setting. Both are good strong noise sources, and real DX!
D.W. Bray, K2LMG
P.H. Kirchner, W2YBP.